
Sections
Research, design, and simulation require reliable and accurate data. Use these principles and best practices for reporting experimental results.
Chemical process research, development, and computer simulation rely heavily on property data, such as the thermophysical, thermochemical, and related properties of chemical compounds and materials (1). Such projects usually begin with a literature search of publications with measurements on the systems of interest. Sometimes, articles are found that contain the desired information, allowing work to begin. Other times, nothing is uncovered, so an expensive in-house experimental program must be initiated. Often, however, the data found are inaccurate, incomplete, or ill-defined, rendering the published work of little or no value. Unfortunately, these situations occur in the scientific literature across all disciplines. In addition to causing everything from frustration, to wasted effort and money, to unsafe designs, an immense amount of valuable information has been, and continues to be, lost forever because of incomplete or imprecise publication.
This problem was recognized some years ago (2) and later reiterated with specific recommendations for phase equilibrium studies (3). However, discussions with industrial leaders such as Ralf Dohrn (Bayer) and Kevin Joback (Molecular Knowledge Systems, Inc.) confirm that the situation still needs improvement. This prompted the formation of an international group of chemical engineers and experts in experimental methods and data analysis to contribute to an International Union of Pure and Applied Chemistry (IUPAC) project, “Good Reporting Practice for Thermophysical and Thermochemical Property Measurements” (https://iupac.org/project/2019-013-1-100). The group expressed nine principles for data publications to meet the needs and expectations of readers, property data users, taxpayers, and research sponsors. The project report (4) presents these principles and provides specific examples for communicating results from different kinds of measurements.
This article provides representative examples of ineffective data communication and the principles of proper data reporting intended to prevent those mistakes, and also introduces elements of good research practice.
The authors of the report believe that following these principles will significantly raise the quality, reproducibility, and usefulness of experimental data; bring greater consistency of results; and advance the efficiency and impact of research and practice.
Examples of inadequate data reporting
Before articulating the principles of good data reporting, we present some examples to illustrate what you may encounter when seeking well-defined, quantitative experimental information from the literature. The data may be unavailable or impossible to interpret (Cases 1 and 2), lack credibility (Cases 3 to 7), or be hard to utilize (Cases 8 and 9) because of poor reporting. Here, we identify some common types of problems and their causes.
1. Numerical data are not reported. Chemical engineers and other practitioners need numerical values of measured property data to produce and assess models for process design. Unfortunately, measured data are sometimes not provided in numerical form. Four typical situations include:
- the measured data are not provided in any form (only a vague statement that something was measured to prove a scientific concept)
- the measured data are only provided in plots
- the measured data are only provided as smoothing equations
- the derived properties are provided but not the primary measured data (e.g., excess volumes instead of densities; enthalpies of vaporization instead of vapor pressures used to derive them).
The first situation usually leads to a complete loss of data, even if the authors can be reached. This situation is cleverly illustrated by the video “Data Sharing and Management Snafu in 3 Short Acts” created by Hanson et al. (5). The animated video is centered around a scientific article that does not numerically report the experimental data. A reader interested in those data made three attempts to contact the lead author of that paper with the following outcomes: (a) no data was received because a flash memory with them was lost, (b) the data was later received but the electronic format was outdated, and (c) the data file was accessed but the values were uninterpretable because of mislabeling by a student, who can no longer be found. In the end, the reader angrily concludes: “I think I cannot use your data!”
Next, providing only graphical representation of data is bad practice. Figure 1 shows a graph (in which identifying information of the source and studied compounds was eliminated) published in one scientific article. Surface tensions for a family of compounds were plotted vs. temperature, but no data were tabulated in the article. Digitizing these data would waste the reader’s time and provide only rough values. Further, much of the data is indistinguishable, and no information about uncertainties is provided.
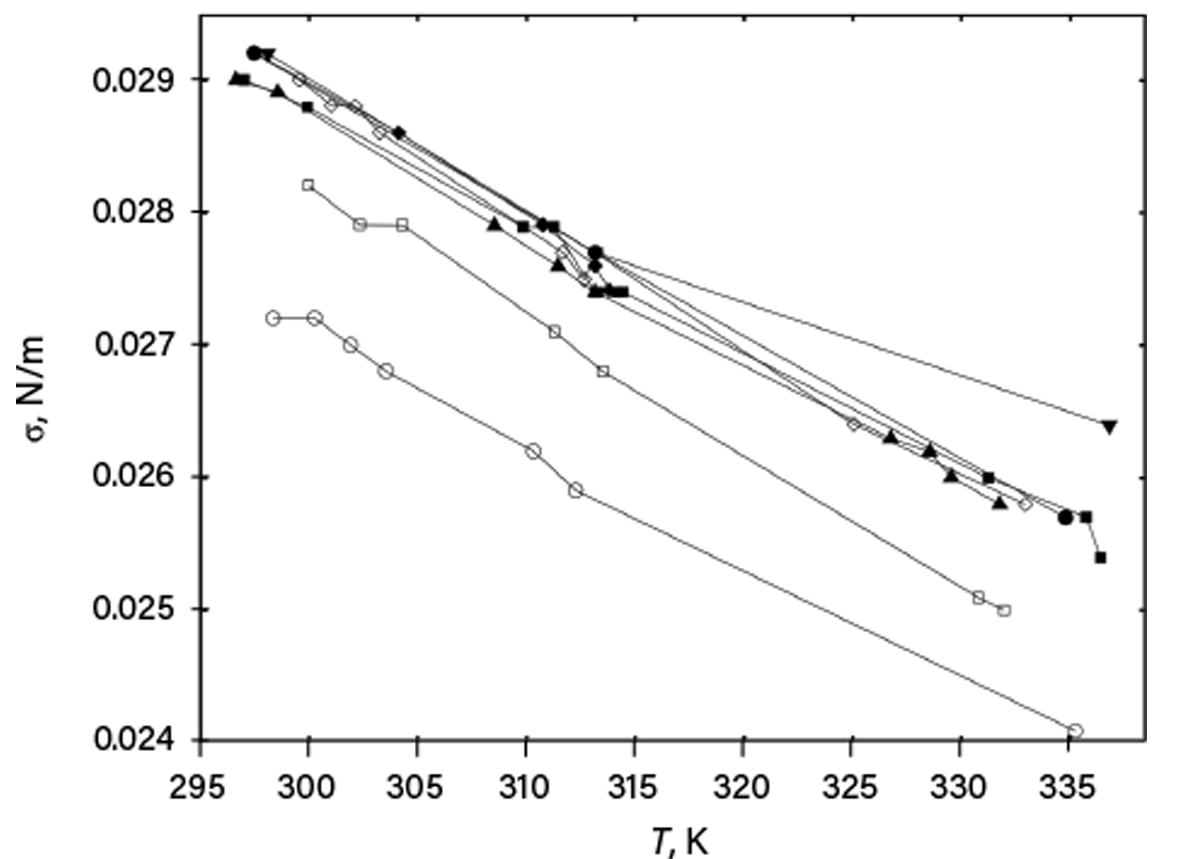
▲Figure 1. An article provided this plot of surface tension (σ) vs. temperature (T) for a family of compounds with different carbon chain lengths (filled symbols) and branching (open symbols), but did not include numerical values nor uncertainties.
Reporting data as smoothing equations without tabulating property data is also insufficient, because there is no information about the number of measured points and their deviations from the equation. In addition, a single typographical error in an equation term may destroy all the data. For example, one article reported measured saturated vapor pressures for Compound A over the temperature range (19–31°C) only as Eq. 1:

In this case, even more issues are present: the base of the logarithm and units for vapor pressure and temperature were not given. The temperature unit (K) is apparent from the equation type, but the pressure unit is unclear. Figure 2 shows results assuming that the logarithm base is 10 and pressure is in torr — reasonable assumptions for the year of publication (1973). However, if we compare those values to data published later by other researchers, we conclude that our guess was wrong (although the slope seems correct).
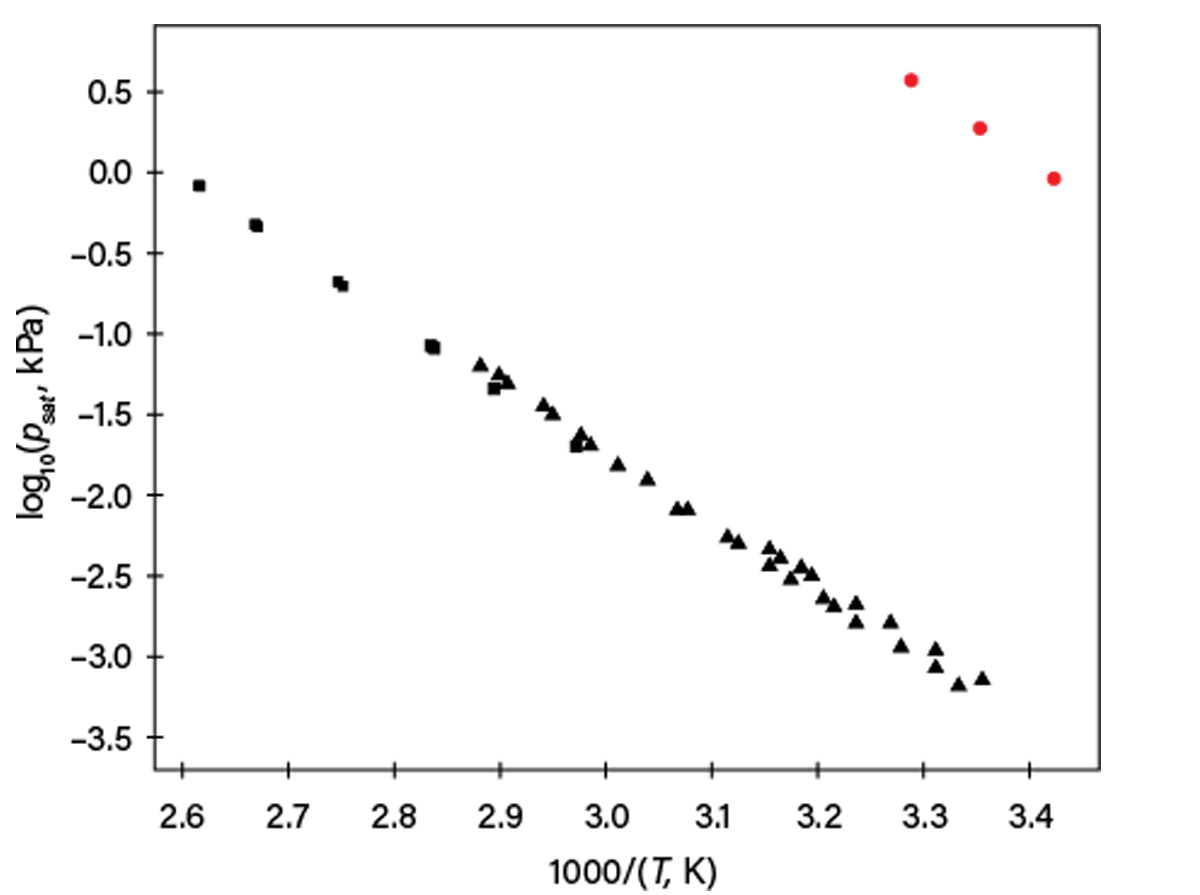
▲Figure 2. This plot shows vapor pressures (psat) for Compound A as a function of reciprocal temperature (1/T). Red circles assume that Eq. 1 used base 10 logarithm and pressure was in torr (here converted to kPa). Triangles and squares are from later publications. Other assumptions of pressure units in Eq. 1 were also not consistent with newer data.
Finally, primary data must be given to ensure the reliability of a derived property. For example, micelle formation studies typically report critical micelle concentration (CMC) derived from electrical conductivity as a function of surfactant concentration by a change in slope, but measured electrical conductivity values are frequently not provided. As experience shows, when original data are requested from authors, the electrical conductivity values can be orders of magnitude different from expectations for dilute solutions; or the water quality is poor, so the conductivity is too high; or an anomalous dependence of the conductivity on temperature is seen, etc. Thus, without the primary data, the reported CMC values cannot be considered reliable.
2. Data are reported but incompletely or ambiguously defined. This includes identifying the studied object (substance or material and the actual sample), property, phases, state variables, and units. Examples of ambiguous reporting include: molarities or volume fractions without specification of the conditions (since volume varies with temperature and pressure), or properties such as saturated vapor pressure without phase and/or unit specification (as illustrated by Eq. 1).
All property data must be related to specific compounds or mixtures. Identities of substances acquired commercially are typically checked and guaranteed by the manufacturers. However, if a compound has been synthesized by authors, a proof of its chemical identity is needed, since the actual synthesis product may, for example, contain significant amounts of impurities or even be another substance. Without proof of compound identity, any measured property for that sample may be misleading. Sometimes, especially for medical substances, trade or traditional names may be insufficient and require specification of the actual chemical form — base, salt, hydrate, etc., which are completely different compounds (e.g., vitamin C can be supplied either as ascorbic acid or as calcium ascorbate).
If a substance has isomers or stereoisomers (diastereomers or enantiomers), the actual isomer should be identified. Though some properties may not vary significantly with stereoisomeric composition, dramatic effects can occur for melting, solid solubility, or sublimation pressure. Figure 3a and Figure 3b show typical melting diagrams of enantiomeric mixtures: one with a simple eutectic (i.e., two enantiomers form separate crystals) and another with formation of an intercomponent (racemic) compound (i.e., cocrystal of enantiomers). Figure 3c and Figure 3d schematically show expected solubility diagrams for these systems. Clearly, not knowing compositions even for enantiomer mixtures may result in process design failure.
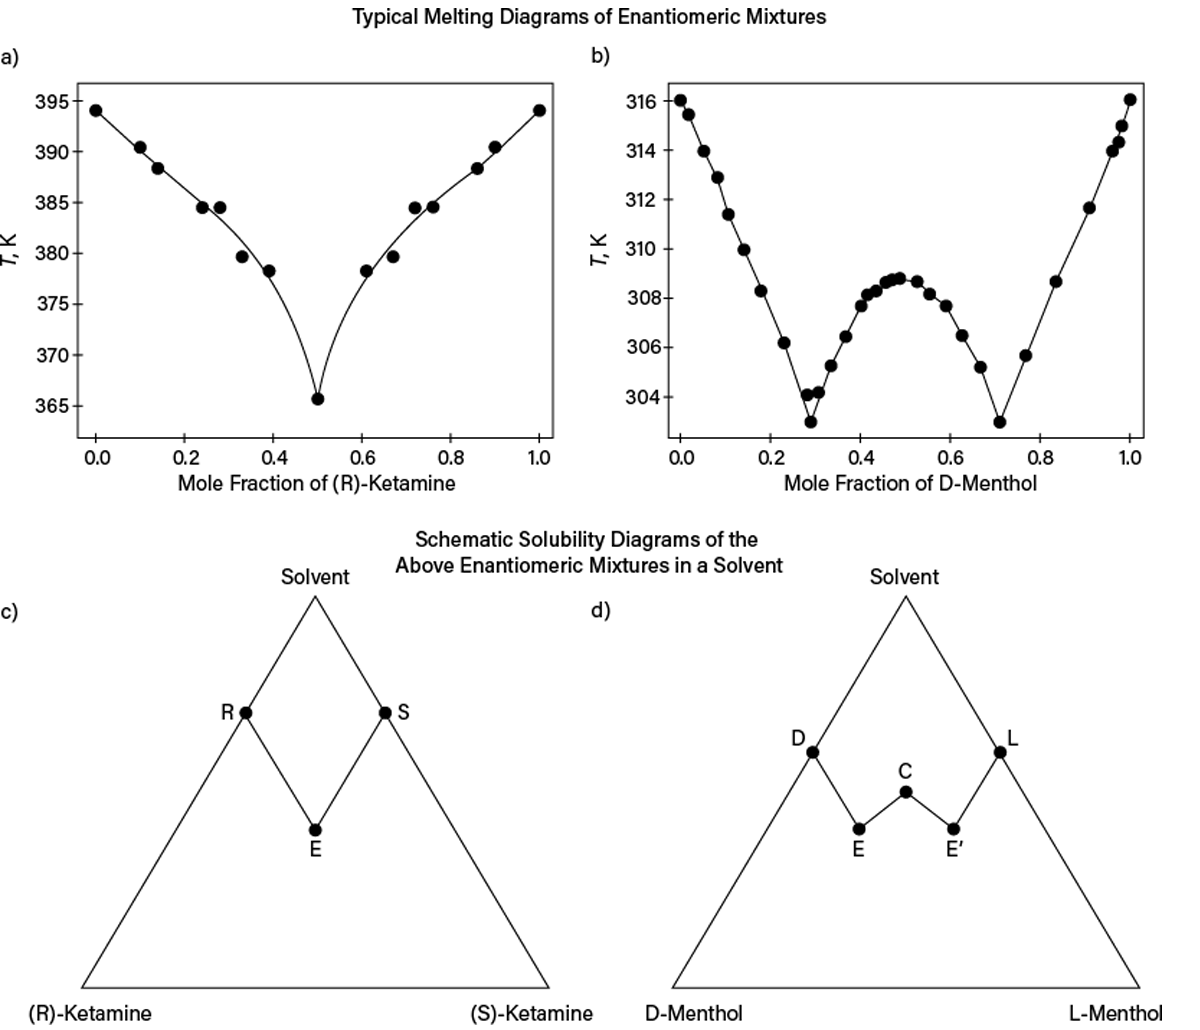
▲Figure 3. The (a) melting (liquidus) and (c) solubility diagrams at 0.1 MPa for (R)- and (S)-ketamine mixtures use experimental melting data from Ref. 6. The (b) melting (liquidus) and (d) solubility diagrams at 0.1 MPa for D- and L-menthol mixtures use experimental melting data from Ref. 7. The lines in (a) and (b) are for visual guidance only and show that the ketamine racemic mixture (mole fraction of 0.5) forms a simple eutectic, while the racemic mixture of menthol forms a 1:1 intercomponent compound. (c) Points R and S or (d) Points D and L on the solubility triangles denote pure-component solubilities. In (c), Point E corresponds to a eutectic-like state where the liquid solution is saturated with crystals of both pure stereoisomers. In (d), Points E and E’ correspond to two eutectic-like states (i.e., the liquid solution is saturated with crystals of one stereoisomer and the corresponding solid-state racemic compound), while Point C is the solubility of the racemic compound in the solvent.
Table 1, reporting liquid-liquid equilibrium (LLE) data for components listed as A and B (identifying information has been removed), illustrates problems with incomplete state-variable specification. The second column indicates a composition x along the binodal LLE curve without identifying the component. It would be normal to expect x to be the mole fraction of A. However, LLE data for this system published later by other researchers revealed that this is not the case. Figure 4a shows our initial guess described previously, while Figure 4b reconciles the data when x is redesignated as the mole fraction of Component B. Although this case was unraveled after new property data were published later, many similar cases cannot be solved, leaving useless or misleading data.
| Table 1. One publication provided binodal liquid-liquid equilibrium (LLE) data for a Mixture A and B in a table like this. The table and column headings are shown as in the original publication, which did not define the meaning of x. Only a portion of the original table is shown for simplicity. | ||
| Number | x | Tbinodal, K |
| 1 | 0.0920 | 299.90 |
| 2 | 0.1020 | 302.85 |
| ··· | ··· | ··· |
| 22 | 0.5500 | 305.00 |
| 23 | 0.5900 | 302.80 |
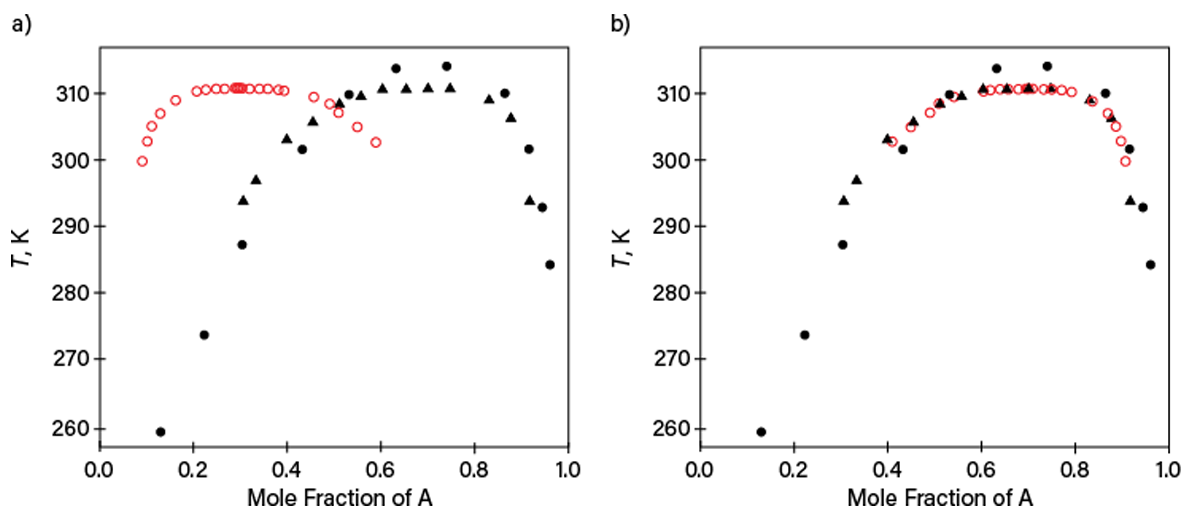
▲Figure 4. These plots show LLE data at 0.1 MPa that were listed in the original version of Table 1 (open red symbols) and published later in two independent works (filled symbols) for Mixture A and B. (a) One plot assumes x reported in Table 1 to be the mole fraction of Component A and (b) the other assumes x reported in Table 1 to be the mole fraction of Component B. Complete specification of table entries must be provided to avoid miscommunication.
3. Data are reported and well-defined, but their origin (measured, predicted, taken from literature) is unclear. It is impossible to judge the reliability of any property data published without knowing their origin. Using such data in process design is potentially dangerous because the errors may significantly exceed the user’s expectations based on a guessed experimental method. An example is the solubility of a mercaptan in an organic solvent that was published only once but without identification of its origin (obtained by those authors or taken from literature) and nature (experimental or estimated, not speaking about the details and expected uncertainty). Unfortunately, this situation is common in certain fields (e.g., thermochemistry of explosives).
4. Indirectly measured data are assigned to a specific phenomenon without justification, while direct observations might actually be attributed to different physical phenomena. Many properties are obtained indirectly, e.g., by interpreting results of direct observations. Typical examples are phase-transition parameters from differential scanning calorimetry (DSC) or solubilities by observing turbidity upon titration. In the literature, these properties may be assigned to certain phase transitions without any justification.
For example, DSC peaks will appear from any exothermic or endothermic processes in the material under examination. But they do not provide information about the nature of the phenomenon to distinguish, for example, melting from solid-to-solid transitions, decomposition, or simply evaporation of a substance from a non-hermetic cell. All assignments of DSC peaks should be supported by evidence, such as X-ray diffraction experiments or comparisons with a published phase diagram.
Observing only turbidity from titration may be insufficient to distinguish solid-liquid equilibria (SLE) or LLE without additional inspection. An example is deep supercooling for the formamide and acetophenone system reported in Ref. 8. As shown in Figure 5, while there are stable SLE and LLE above the monotectic temperature of ~287 K, the liquids can be supercooled, so LLE can be observed below the monotectic temperature. As a result, turbidity for certain compositions upon lowering temperature may correspond to either stable SLE or metastable LLE, depending on the phase nucleation kinetics. Thus, without carefully measuring the whole phase diagram, erroneous phase equilibrium could be assumed. Similar behavior is typical for solutions containing polymers or for systems of salt, water, and organics.
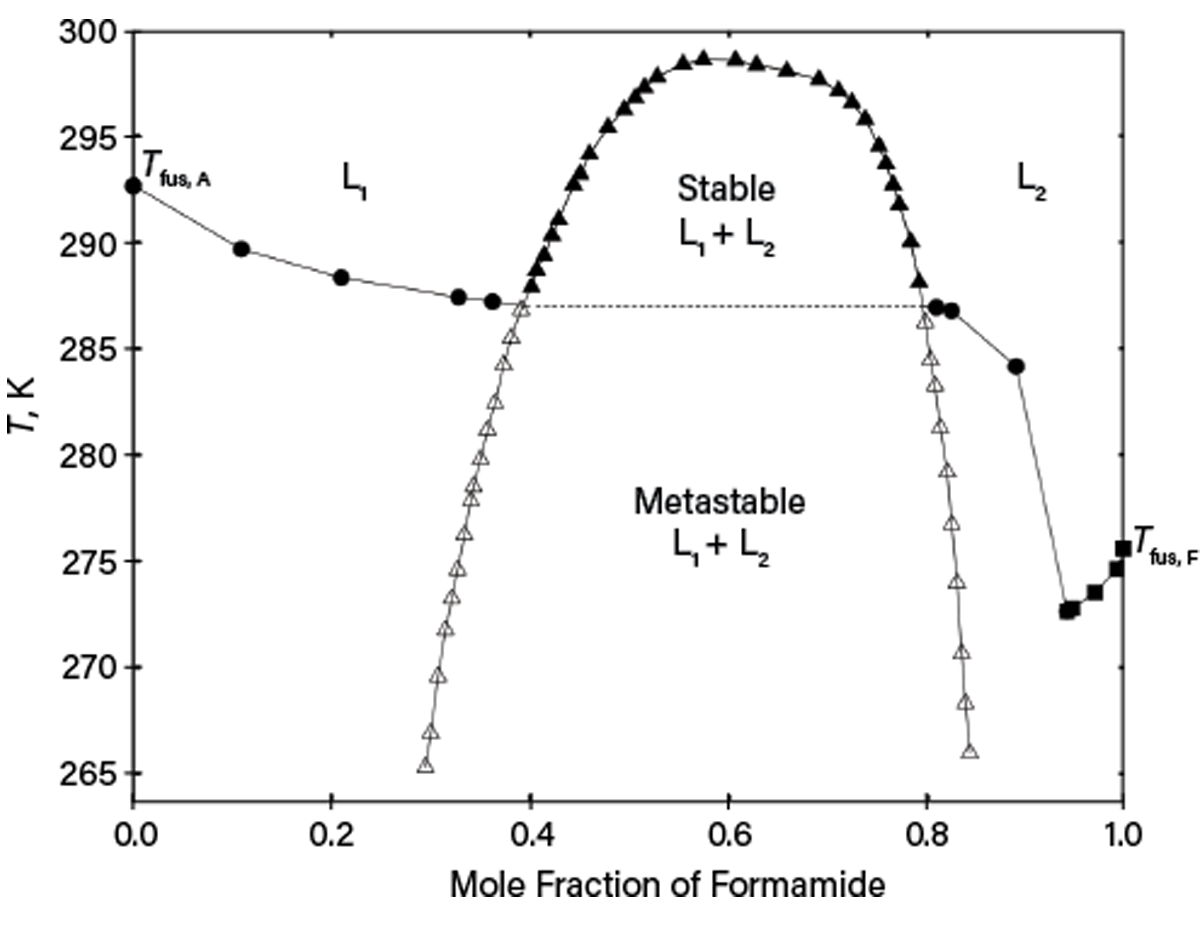
▲Figure 5. This phase diagram of mixtures of formamide (F) and acetophenone (A) at 0.1 MPa was taken from Ref. 8. SLE (liquidus) with pure solid acetophenone (circles) or with pure solid formamide (squares) and LLE (open and filled triangles) are present. Open triangles are used for supercooled LLE.
5. Calibration data are not given or identified. Many measurement methods require calibration, so it is important to communicate which reference data were used for calibration. Unfortunately, this information is frequently not provided in some areas, such as temperature and energy calibration of DSC or density- and refractive-index calibration for compositions in phase equilibrium studies. This information allows researchers to assess the reliability of the results and apply corrections if necessary. For example, dipole moments (used for predicting virial coefficients and viscosities) are often measured with equipment calibrated with carbonyl sulfide (COS). However, COS’s dipole moment value was noticeably refined about 50 years ago (9). All dipole moments in publications that reported using the previously accepted reference value for COS have since been successfully corrected. Similar corrections have been made for other properties (e.g., enthalpies of formation of fluorine-containing organic compounds).
6. An experimental method is not sufficiently described to provide confidence in the results. One example of this problem involves vapor-liquid equilibrium (VLE) studies, where pTxy data were listed as experimental data, but the authors did not mention that the gas-phase composition y had actually been derived from a model. In that case, only the pTx subset was measured, so pTxy consistency tests based on the Gibbs-Duhem relation would be inappropriate, and conclusions about azeotropism based on xy data would be unreliable. Other important details (like degassing and sampling) that are crucial for assessing the experimental method are also frequently missing.
7. Uncertainty information is not provided or misleading. Without realistic uncertainty assessment, measured results may be misleading until additional information becomes available. Frequently, a minor contribution to the uncertainty is reported as the total uncertainty, while major contributions are ignored. It is common for more accurate data to be reported with larger uncertainties (when various uncertainty contributions are considered) than for less reliable data.
The issue can be understood from the following published comment: “As water is the only liquid whose viscosity is known to an uncertainty as low as 0.17% … all measurements in which the authors quote uncertainties of less than 0.01%, characteristic of investigators that do not understand how to assess their measurement uncertainty, have been placed in the secondary dataset” (10). An example of this situation is illustrated in Figure 6. The authors of the dataset represented by black circles claimed 1% standard uncertainty, while the authors of the dataset represented by red squares claimed 0.004% to 0.007% as “accuracy” (a term without rigorous definition).
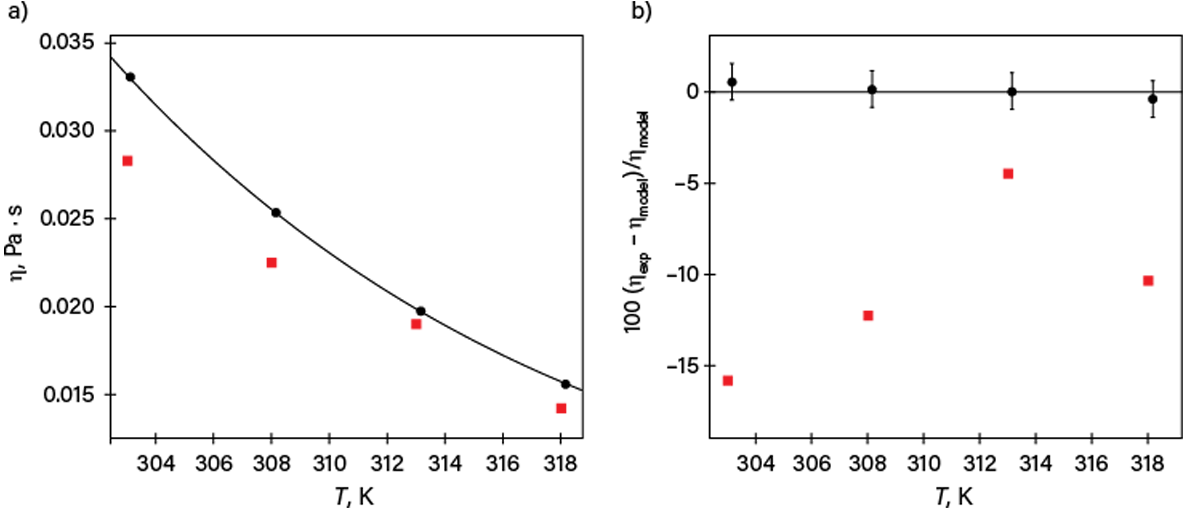
▲Figure 6. (a) Two selected datasets of viscosity (η) are plotted as a function of temperature (T) at 0.1 MPa for Compound X (black circles and red squares) together with a smoothing equation based on 44 datasets (line). (b) The percent deviations of the selected datasets (ηexp) from the equation (ηmodel) are also plotted. The claimed standard uncertainties for the data represented by circles are consistent with the deviations, while those claimed for the less accurate set (squares) are inconsistent — the claimed “accuracies” are even smaller than the symbol size.
8. Even if properly reported and described, data are hard to find in an article. One documented case was for an important measured value (enthalpy of combustion) requiring several days of effort by a highly qualified researcher and costly equipment: the value was only reported in a footnote to a table dedicated to other properties. The existence of that value was discovered by us accidentally; otherwise, it would have remained unnoticed. Other problematic cases involve tables that are not self-explanatory (i.e., it is not possible to understand the contents of a table without studying the whole paper) or are highly convoluted “aesthetically pleasing” tables. For the latter, both readers and authors do extra work — the authors formatting the tables and then the readers deconvoluting them. Table 2 shows the same data (after the identifying information has been removed) structured in a table requiring a lot of effort to extract the data (Table 2a) and in a plain table that is easy to process (Table 2b). Both tables show how self-contained data should appear, i.e., with symbol definitions, all state variables, and all uncertainties.
| Table 2. Here, two different versions of data tabulation show the densities (ρ) of mixtures containing A in aqueous solutions of B at specified temperatures (T) and pressure p = 100 kPa. Both tables use the same data. | ||||||
| Table 2a. Complex table that is difficult to process. | Table 2b. Plain table that is easy to process. | |||||
| T, K | *mA, mol/kg | ρ, g/cm3 | T, K | †mB, mol/kg | *mA, mol/kg | ρ, g/cm3 |
| water + 0.10 mol/kg B | 303.15 | 0.10 | 0 | 0.9972 | ||
| 303.15 | (‡ρo = 0.9972) | 303.15 | 0.10 | 0.0570 | 1.0045 | |
| 0.0570 | 1.0045 | 303.15 | 0.10 | 0.0814 | 1.0076 | |
| 0.0814 | 1.0076 | 303.15 | 0.10 | 0.0961 | 1.0094 | |
| 0.0961 | 1.0094 | 308.15 | 0.10 | 0 | 0.9956 | |
| 308.15 | (‡ρo = 0.9956) | 308.15 | 0.10 | 0.0570 | 1.0029 | |
| 0.0570 | 1.0029 | 308.15 | 0.10 | 0.0814 | 1.0060 | |
| 0.0814 | 1.0060 | 308.15 | 0.10 | 0.0961 | 1.0078 | |
| 0.0961 | 1.0078 | 303.15 | 0.30 | 0 | 1.0003 | |
| water + 0.30 mol/kg B | 303.15 | 0.30 | 0.0436 | 1.0060 | ||
| 303.15 | (‡ρo = 1.0003) | 303.15 | 0.30 | 0.0525 | 1.0072 | |
| 0.0436 | 1.0060 | 303.15 | 0.30 | 0.0914 | 1.0122 | |
| 0.0525 | 1.0072 | 308.15 | 0.30 | 0 | 0.9986 | |
| 0.0914 | 1.0122 | 308.15 | 0.30 | 0.0436 | 1.0043 | |
| 308.15 | (‡ρo = 0.9986) | 308.15 | 0.30 | 0.0525 | 1.0055 | |
| 0.0436 | 1.0043 | 308.15 | 0.30 | 0.0914 | 1.0104 | |
| 0.0525 | 1.0055 | |||||
| 0.0914 | 1.0104 | |||||
|
*mA = molality of A in (water and B) solvent †mB = molality of B in water ‡ ρo = density of (water and B) solvent without A Note: Standard uncertainties u and relative standard uncertainties ur are u(p) = 2 kPa (atmospheric pressure variation), u(T) = 0.01 K (manufacturer’s specification), u(mB) = 0.01 mol/kg (based on weighing accuracy and sample purities), ur(mA) = 0.01 (based on weighing accuracy and sample purities), and u(ρ) = 0.001·ρ (based on the observed scatter and purities). |
||||||
9. Mathematical models that represent data or are useful in process design are reported in a way that requires re-derivation in order to be used. In one article, while authors developed and presented a model, they did not publish computer code in a machine-readable form, only mathematical equations manually retyped in the text. Unfortunately, an equation had a typographical error, resulting in erroneous implementation of the model. Though models do not report actual experimental data, they may be important accompanying information as well as part of the research.
The next section describes the principles of good reporting practice to address these and other similar situations that IUPAC project participants have identified.
Nine principles of good reporting practice
The IUPAC project report (4) contains full statements of nine principles of good reporting practice with an appendix that lists representative examples for each principle. Here, we summarize the important elements. The principles are grouped into three categories.
Group 1 (essential): Actual data reporting and identification
Principle 1. Measured property data should be published in a numerical format (at least in a supplement). All primary measured property data should be provided in numerical form (either as tables or as standalone values). The principle equally refers to the main properties of interest and to measured auxiliary data (e.g., results of validation experiments, pure-component endpoints for mixture properties, additional measured properties necessary to complete data processing or modeling).
Principle 2. Published data should be well-defined (including system, state, and property). “Well-defined” means including clear identification/specification for:
- substance or material (with identification of isomers)
- studied samples (source, purification methods used, purity, purity analysis method)
- properties (readers are referred to the IUPAC Green Book (11) for accepted definitions of various properties)
- phases
- state variables (e.g., temperature, pressure, and composition)
- units for every property and state variable (e.g., temperature and pressure in Eq. 1).
Group 2: Data traceability and reliability
Principle 3. All published data should be traceable to their origin. Data obtained from the authors’ or others’ publications should be accompanied by references and identification of their nature (experimental, calculated, or evaluated).
Principle 4. Observations should be distinguished from interpretation. For indirectly measured properties, it should be clearly distinguished what is actually seen in the experiment and how that observation was interpreted. The reasoning behind interpretations should always be explained.
Principle 5. Auxiliary (calibration) data should be identified and provided. For measurements requiring calibration, reference data used for calibration must be clearly specified, including their source. Similarly, if auxiliary properties of studied and accessory substances were used for deriving a target property, those auxiliary values and references to their source (if taken from the literature) should be also provided.
Principle 6. Necessary details of experimental methods or computation procedures should be given. In order to provide evidence of correct implementation and to allow reproduction by other researchers, complete description of measurements and computations must be provided.
Principle 7. Uncertainty in each measured value should be reported and justified. To provide credible information, uncertainties are to be provided with justification covering factors such as sample purity, deviations from the equilibrium state, variations of experimental conditions, device characteristics, and calibration. Readers are referred to the Guide to the Expression of Uncertainty in Measurement (GUM) for general principles of evaluating and expressing uncertainty (12).
Group 3: Data reporting convenience
Principle 8. Importing reported data into analysis software should be easy and straightforward for readers. It is best practice to use self-explanatory and self-sufficient plain tables representing all state variables in a single flow with all symbol definitions and uncertainties (e.g., Table 2b in the previous section).
Principle 9. Complex mathematical equations should be provided in a machine-readable form. This may be symbolic mathematics or programming languages. The goal is to save the users’ (and possibly the authors’) time and prevent typing and reproduction errors.
Though not one of these principles, it should be standard practice that, as soon as errors are detected, there is immediate submission of corrigenda, including visibility on the main publication web pages.
Elements of good research practice
The IUPAC report (4) concludes with a brief section on elements of good research practice, because it was found that issues in reporting can also arise from poor experimental practices. The principal message is that well-designed research should solve problems rather than create them. Though problems may be revealed but not immediately solved, thoughtful research should minimize remaining questions. Minor additional measurements (such as endpoints or related properties) may significantly amplify the impact of a research effort. Some elements and examples of good research practice that might achieve that goal are given in Ref. 4, covering the aspects of experimental planning, methodology, and validation.
Literature Cited
- Kontogeorgis, G. M., et al., “Industrial Requirements for Thermodynamic and Transport Properties: 2020,” Industrial & Engineering Chemistry Research, 60 (13), pp. 4987–5013 (2021).
- Chirico, R. D., et al., “Improvement of Quality in Publication of Experimental Thermophysical Property Data: Challenges, Assessment Tools, Global Implementation, and Online Support,” Journal of Chemical & Engineering Data, 58 (10), pp. 2699–2716 (2013).
- Chirico, R. D., et al., “Guidelines for Reporting of Phase Equilibrium Measurements (IUPAC Recommendations 2012),” Pure and Applied Chemistry, 84 (8), pp. 1785–1813 (2012).
- Bazyleva, A., et al., “Good Reporting Practice for Thermophysical and Thermochemical Property Measurements (IUPAC Technical Report),” Pure and Applied Chemistry, 93 (2), pp. 253–272 (2021).
- Hanson, K., et al., “Data Sharing and Management Snafu in 3 Short Acts,” https://www.youtube.com/watch?v=N2zK3sAtr-4 (accessed Oct. 31, 2021).
- Tamagawa, R. E., et al., “Determination of the Binary and Ternary Phase Diagrams of R(+)-/ S(-)-Ketamine Using Differential Scanning Calorimetry,” Journal of Chemical & Engineering Data, 54 (1), pp. 16–21 (2009).
- Corvis, Y., et al., “Insights into the Crystal Structure, Polymorphism and Thermal Behavior of Menthol Optical Isomers and Racemates,” CrystEngComm, 14, pp. 7055–7064 (2012).
- Sedlakova, Z., et al., “Solid-Liquid and Liquid-Liquid Equilibrium in the Formamide–Acetophenone System,” Collection of Czechoslovak Chemical Communications, 71 (9), pp. 1350–1358 (2006).
- Muenter, J. S., “Electric Dipole Moment of Carbonyl Sulfide,” Journal of Chemical Physics, 48 (10), pp. 4544–4547 (1968).
- Mebelli, M., et al., “Reference Correlation for the Viscosity of Ethane-1,2-diol (Ethylene Glycol) from the Triple Point to 465 K and up to 100 MPa,” International Journal of Thermophysics, 42, #116 (2021).
- Cohen, E. R., et al., “Quantities, Units, and Symbols in Physical Chemistry, IUPAC Green Book,” IUPAC & RSC Publishing, Cambridge, U.K. (2007).
- Joint Committee for Guides in Metrology, “JCGM 100:2008, Evaluation of Measurement Data – Guide to the Expression of Uncertainty in Measurement,” BIPM, Sèvres, France (2008).

Copyright Permissions
Would you like to reuse content from CEP Magazine? It’s easy to request permission to reuse content. Simply click here to connect instantly to licensing services, where you can choose from a list of options regarding how you would like to reuse the desired content and complete the transaction.