
Sections
- Three common types of clayey soil formations
- What could be wrong with clayey soil?
- Problems with Clayey soil evaluation
- Using isotopes in water molecules to evaluate containment potential by a clayey aquitard
- Using 18O and 2H to estimate groundwater age
- Using 3H to estimate groundwater age
- Case studies involving isotopes to evaluate containment potential
- Final thoughts
- Literature Cited
When designing lagoons and landfills, it’s important to understand how clayey soil formed and changed during its geologic past, as well as how containment potential is evaluated.
Containing contaminants that leak from the disposal or storage of solid and liquid waste in landfills or lagoons has always been a challenge for industry and municipalities. Clayey soil formations may help to prevent the release of contaminants into geologic formations, where the contaminants may affect drinking water quality, indoor air quality, and/or surface water quality. Typically, it is assumed that a thick layer of natural clayey soil beneath a disposal area should provide good protection against contaminating the underlying groundwater. However, because natural clayey soil formations originate in different ways and/or change after their formation, they can pose distinct challenges for waste disposal and storage.
The primary attribute of clayey soils for containing waste is their low hydraulic conductivity, a soil property that indicates how easily groundwater (and chemicals) can move through them. Clayey soils have hydraulic conductivity values that typically range from about 1×10⁻⁶ to 1×10⁻⁹ cm/sec (1, 2). This means water will move through the most permeable clays at least 1,000 times slower than through the least permeable sand. The literature (e.g., Ref. 3) indicates that groundwater movement in some clayey soils is so slow that chemicals in the groundwater move only centimeters per year, primarily due to diffusion (chemical concentration gradients) rather than advection (groundwater movement).
This article discusses how clayey soils form and change, problems with measuring their hydraulic conductivity and continuity, and how isotopes in water molecules can help in evaluating containment potential.
Three common types of clayey soil formations
Clayey soils can originate in several ways. Three common modes of formation in North America include direct deposition of entrained material from continental glaciers, deposition from meltwater lakes associated with glaciation, and deposition from rivers.
Deposition from continental glaciers. Continental glaciation, which covered most of Canada and much of the northern U.S. more than 10,000 years ago, is responsible for large sheets of clayey soil in those areas. For example, the clayey soils beneath Detroit, MI, and other areas around the lower Great Lakes, called glacial till, may be more than 30-m thick and extend for tens of kilometers or more laterally. Glacial tills consist of an unsorted mixture of clay (<0.002 mm particles), silt (0.002–0.05 mm), sand (0.05–2 mm), and gravel (>2 mm) (using the U.S. Dept. of Agriculture soil classification limits). Since the continental glaciers were thick masses of ice (up to thousands of meters thick), they not only deposited soil entrained in the ice, but they also compacted it. Figure 1 is a photo of a vertical drill core of glacial till from a site in Flint, MI.
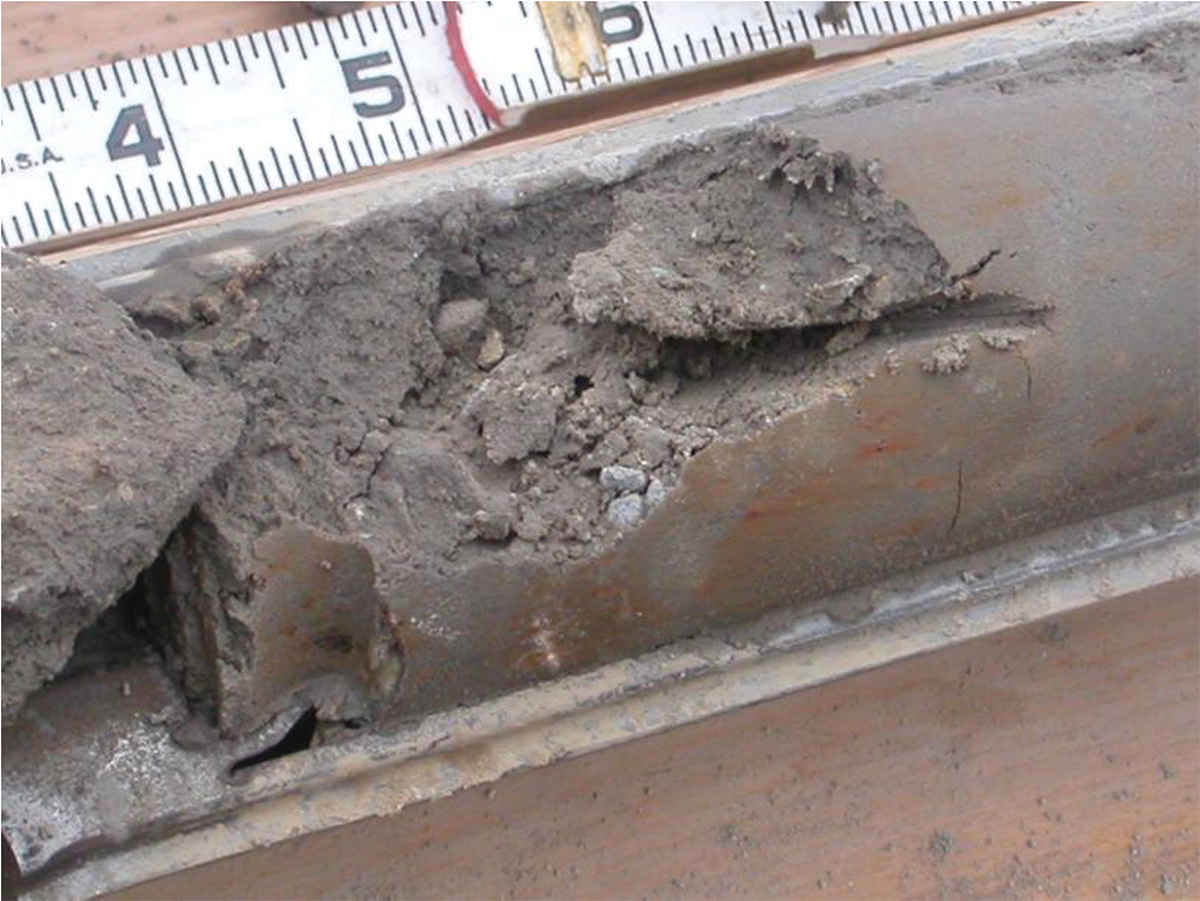
▲Figure 1. A split-spoon core sample of glacial till was collected from a former manufacturing site in Flint, MI. Oil in the subsurface was released from the manufacturing process. Note the mixture of clay, silt, and gravel-sized particles, and that the core is dry.
Deposition from meltwater lakes. Vast glacial meltwater lakes associated with the melting continental glaciers left another type of distinctive clayey soil deposit. Glacial Lake Agassiz, for example, covered large portions of what is now Minnesota, North Dakota, Manitoba, Saskatchewan, and Ontario with an extensive sheet of clayey soil more than 30-m thick. Other glacial meltwater lakes in the eastern U.S. and Canada left similar deposits. Unlike glacial till formations, these glacial lake deposits were neither compacted by the glacier mass nor intermixed with sand and gravel. Some of these glacial lake clays, called “varved clays,” consist of alternating layers of clayey and silty soil, which represent annual deposits caused by varying melt rates during the year. While clay particles are small, platy, and cohesive, silt particles are rounded, not cohesive, and form more permeable soils. Figure 2 is a photo of a vertical drill core of varved clay from a site near Hartford, CT.
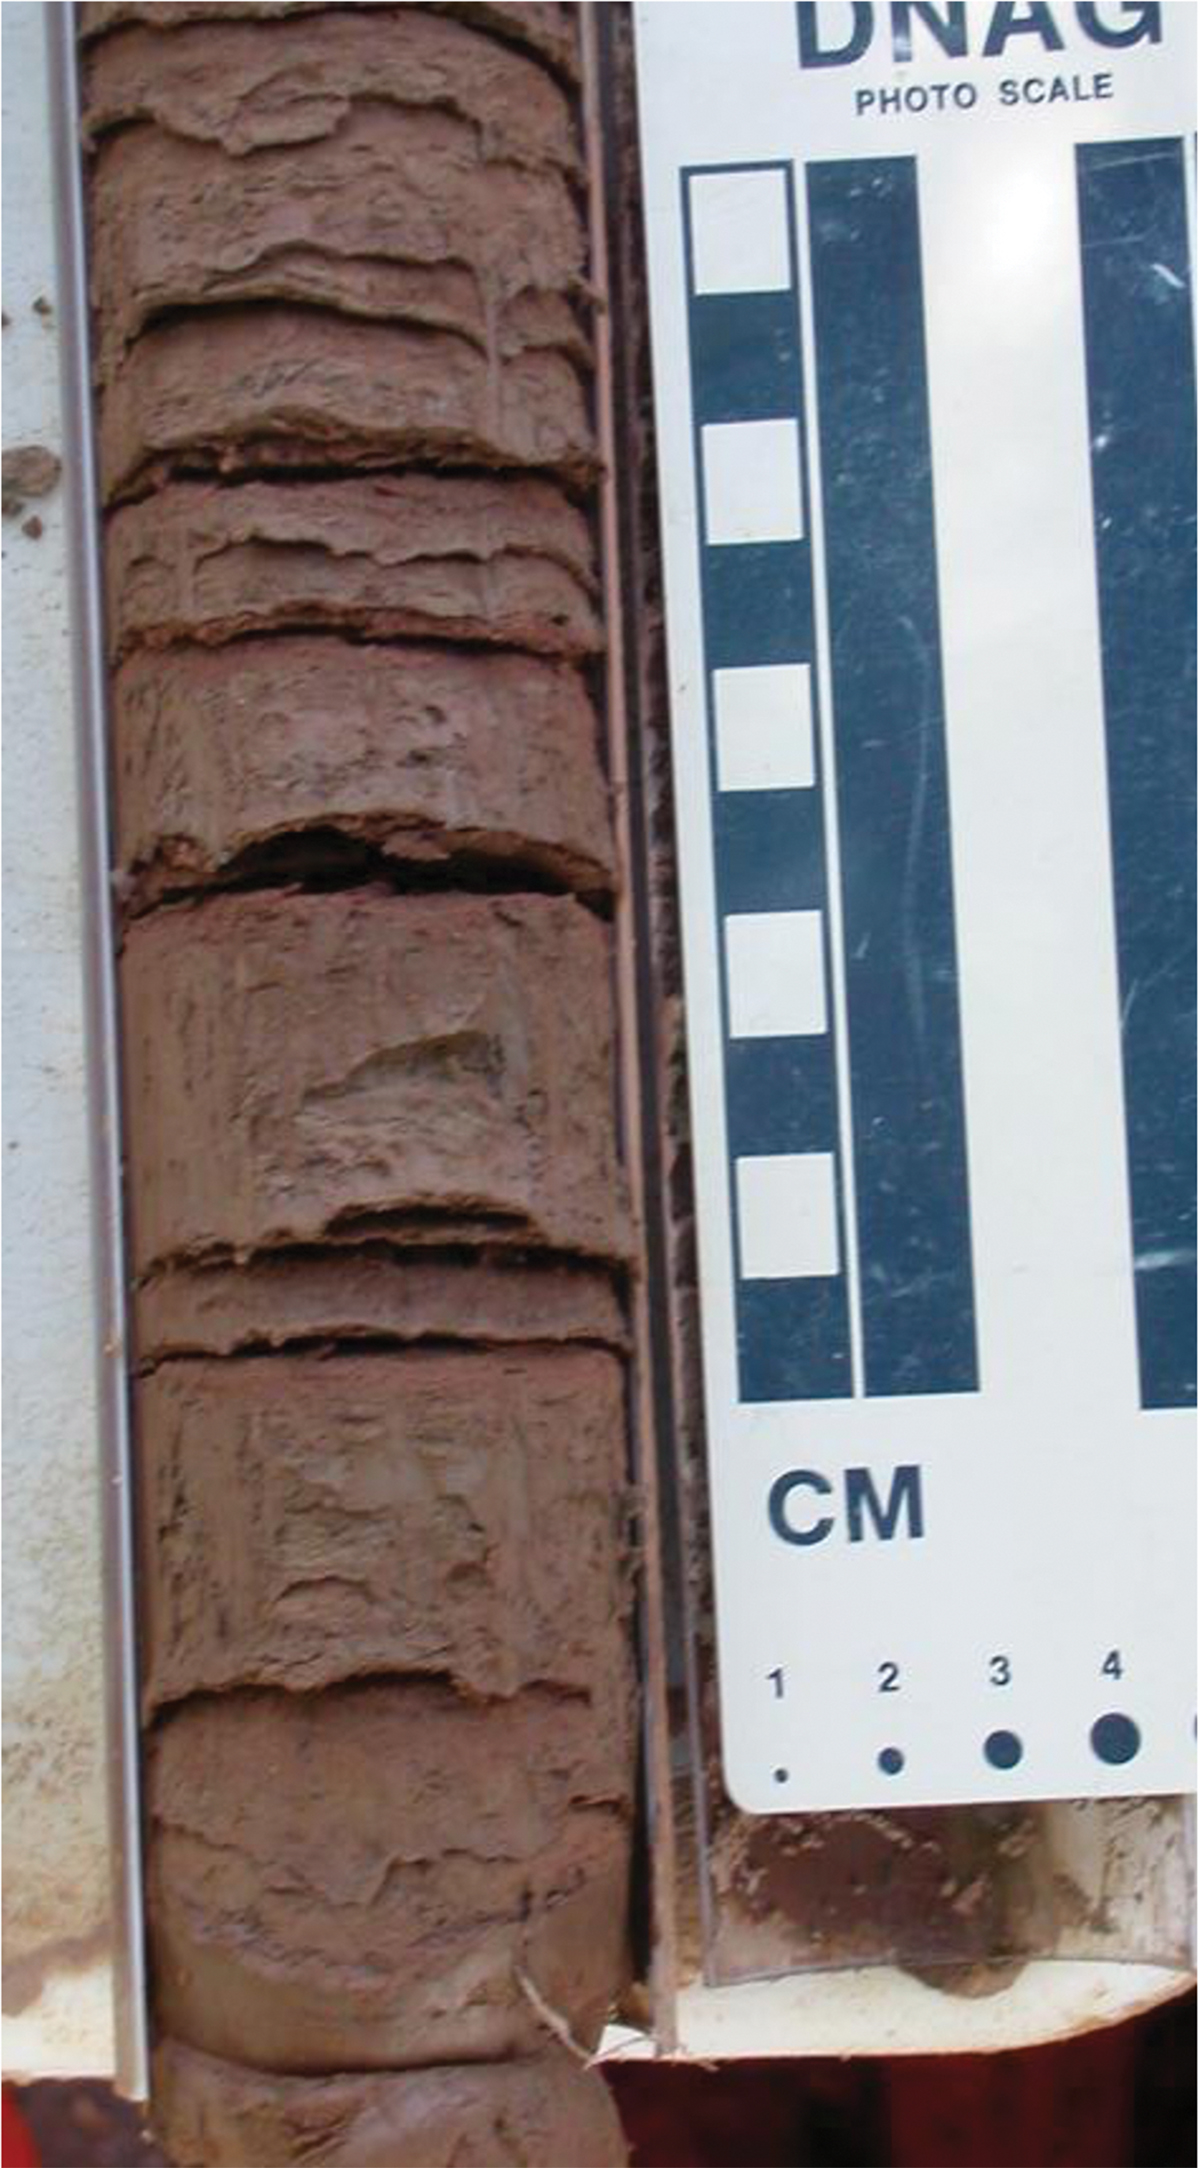
▲Figure 2. A Geoprobe core of varved clay was collected from a former manufacturing site near Hartford, CT, where solvents were released into the ground. The dark horizontal bands are the silty (more permeable) layers, and the thicker, lighter bands are the clayey layers. The cupping around the edges is a remnant of the drilling process.
Deposition from rivers. Sediment carried by rivers has created discrete deposits of clayey soil in some river valleys, called alluvial soils. Alluvial clayey soils can be locally interbedded vertically with, and located adjacent to, zones with more permeable soils. Unlike glacial till formations, the clayey soils were neither compacted by a glacier mass nor completely intermixed with sand and gravel. Unlike glacial tills and varved clays, alluvial clayey soil deposits do not extend in all directions but often form part of an elongated band in a river valley. For example, the alluvial deposits of Dry Creek near Salina, KS, consist of up to 15 m of clayey and silty soil (4). Figure 3 is a photo of construction occurring in an alluvial clay terrain in Salina, KS.
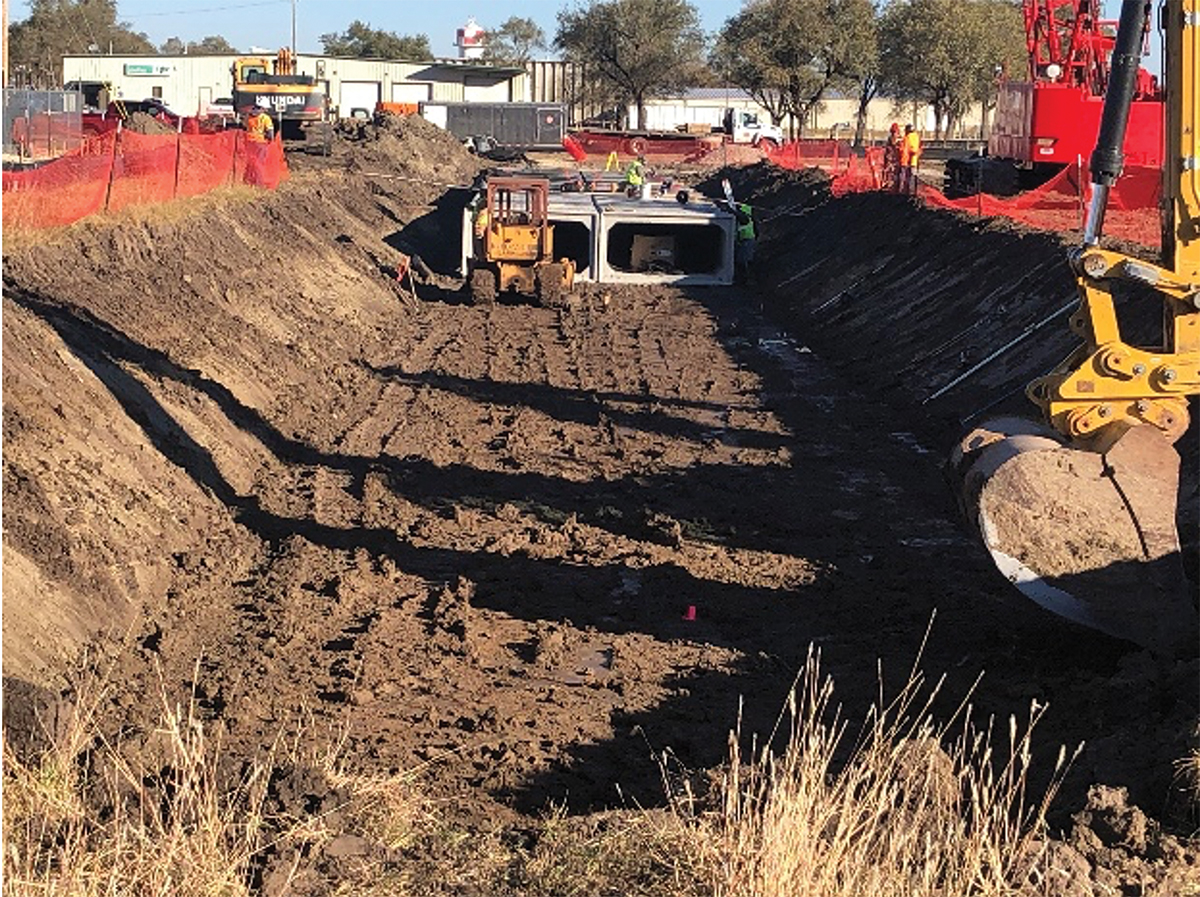
▲Figure 3. Alluvial clays were encountered during installation of a new storm drain in Salina, KS. This site is located on a former Air Force base where metal-cleaning solvents were released from cleaning of aircraft on the tarmac, cleaning of parts in buildings, and landfills. The site has been investigated for potential impacts to indoor air and municipal groundwater. Photo courtesy of Tim Rogers.
What could be wrong with clayey soil?
Clayey soils from continental glaciation, glacial melt-water lakes, and alluvial deposits may act as “aquitards,” geologic formations that inhibit the vertical and lateral movement of groundwater and contaminants due to their low hydraulic conductivity. Cherry et al. (5) provide a detailed state of the science report on aquitards.
A few problems can arise when clayey soil is selected as a site for waste disposal. Fractures, varves, and pinch outs are three routes that may enable groundwater to either bypass the low permeability blocks of clayey soil or move around the entire clay soil deposit.
Fractures. Fractured clays commonly occur at the surface of till sheets. These fractures allow groundwater to move around the low-permeability blocks of clayey soil at a much greater rate than through the blocks. Figure 4 is a photo of the bottom of a test pit excavated into clayey soil in northeastern Ohio at a potential lagoon location. The photo clearly shows groundwater moving into the pit through fractures. Fractures formed when the glacial ice melted and receded, and the till rebounded from the weight of the overlying ice; desiccation of the tills also contributed to fracturing. The fractures in tills in the lower Great Lakes area may extend to about 9 m below ground level (mbgl); they tend to be vertical, and they tend to become progressively less frequent and narrower with depth (6).
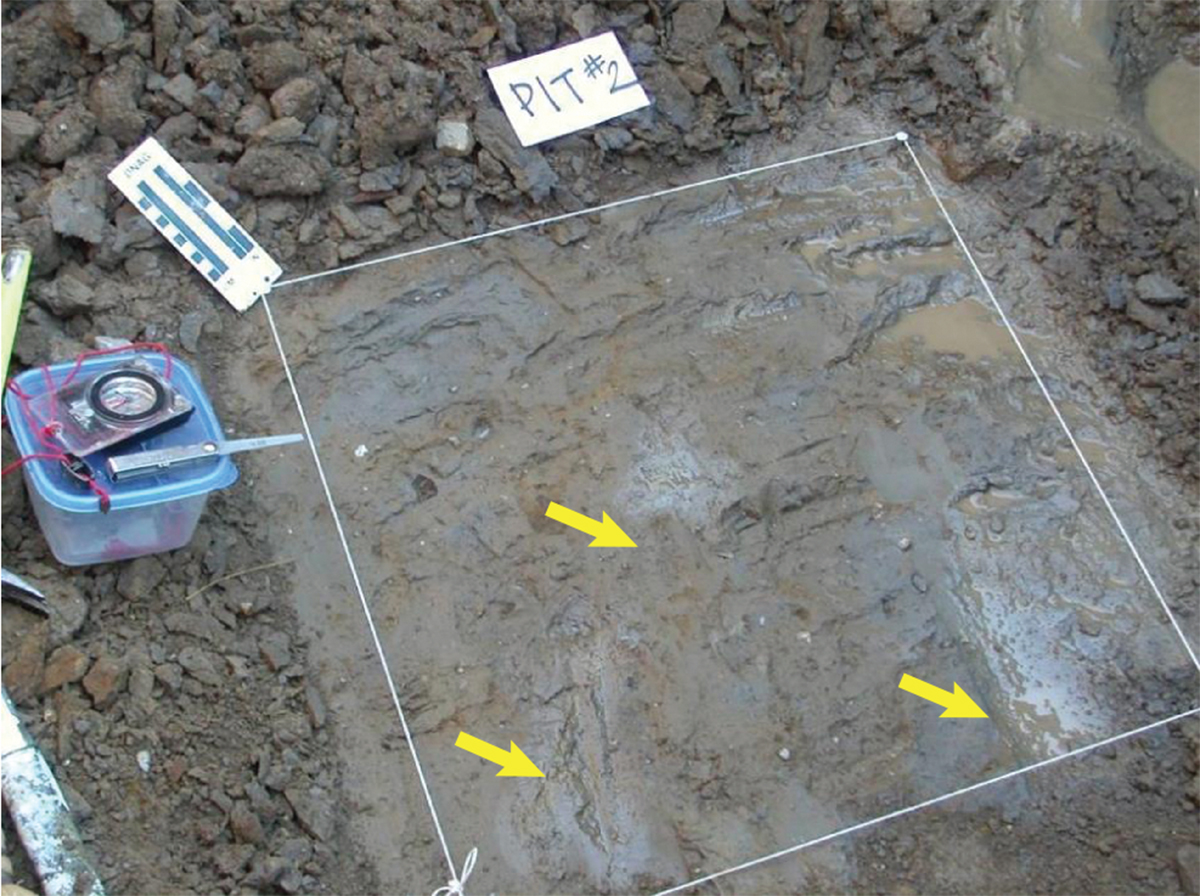
▲Figure 4. This photograph shows the bottom of a test pit used to investigate the nature and thickness of clayey soil for a proposed lagoon to contain manure for a commercial dairy farm in northeastern Ohio. Note groundwater flowing into the pit between the clay blocks (tips of yellow arrows) and the spacing between the fractures.
Varves. Varved clays allow groundwater to move laterally through the silty layers faster than groundwater can move through the low-permeability clayey layers. The partings in Figure 2 are the silty layers in the varves that permit more rapid lateral groundwater movement than through the more massive clayey layers.
Pinch outs. Regardless of the mode of formation, clayey soil formations eventually pinch out laterally. The pinch outs allow groundwater to move around the low-hydraulic-conductivity clayey soil formation. The pinch outs form during the deposition of the clayey soil formation and give the formation a tapered shape like an open book, with a finite areal extent that gradually thins towards the edges.
Problems with clayey soil evaluation
There are several potential problems with how clayey soils are evaluated for waste disposal and storage sites.
First, the hydraulic conductivity of fractured clays cannot be properly characterized using only conventional vertical boreholes. The fractures, which are primarily vertical, may be missed by a vertical boring, especially at depth. As a result, soil samples collected for hydraulic conductivity testing in a laboratory may not include fractures. Figure 5 is a photo of a soil core collected from a boring advanced at a 45-deg. angle into the subsurface to improve the chances of intersecting fractures. The fracture in Figure 5, between about 5.2 mbgl and 5.5 mbgl (17 ft and 18 ft below ground level [fbgl]), would not likely have been encountered with vertical boring.
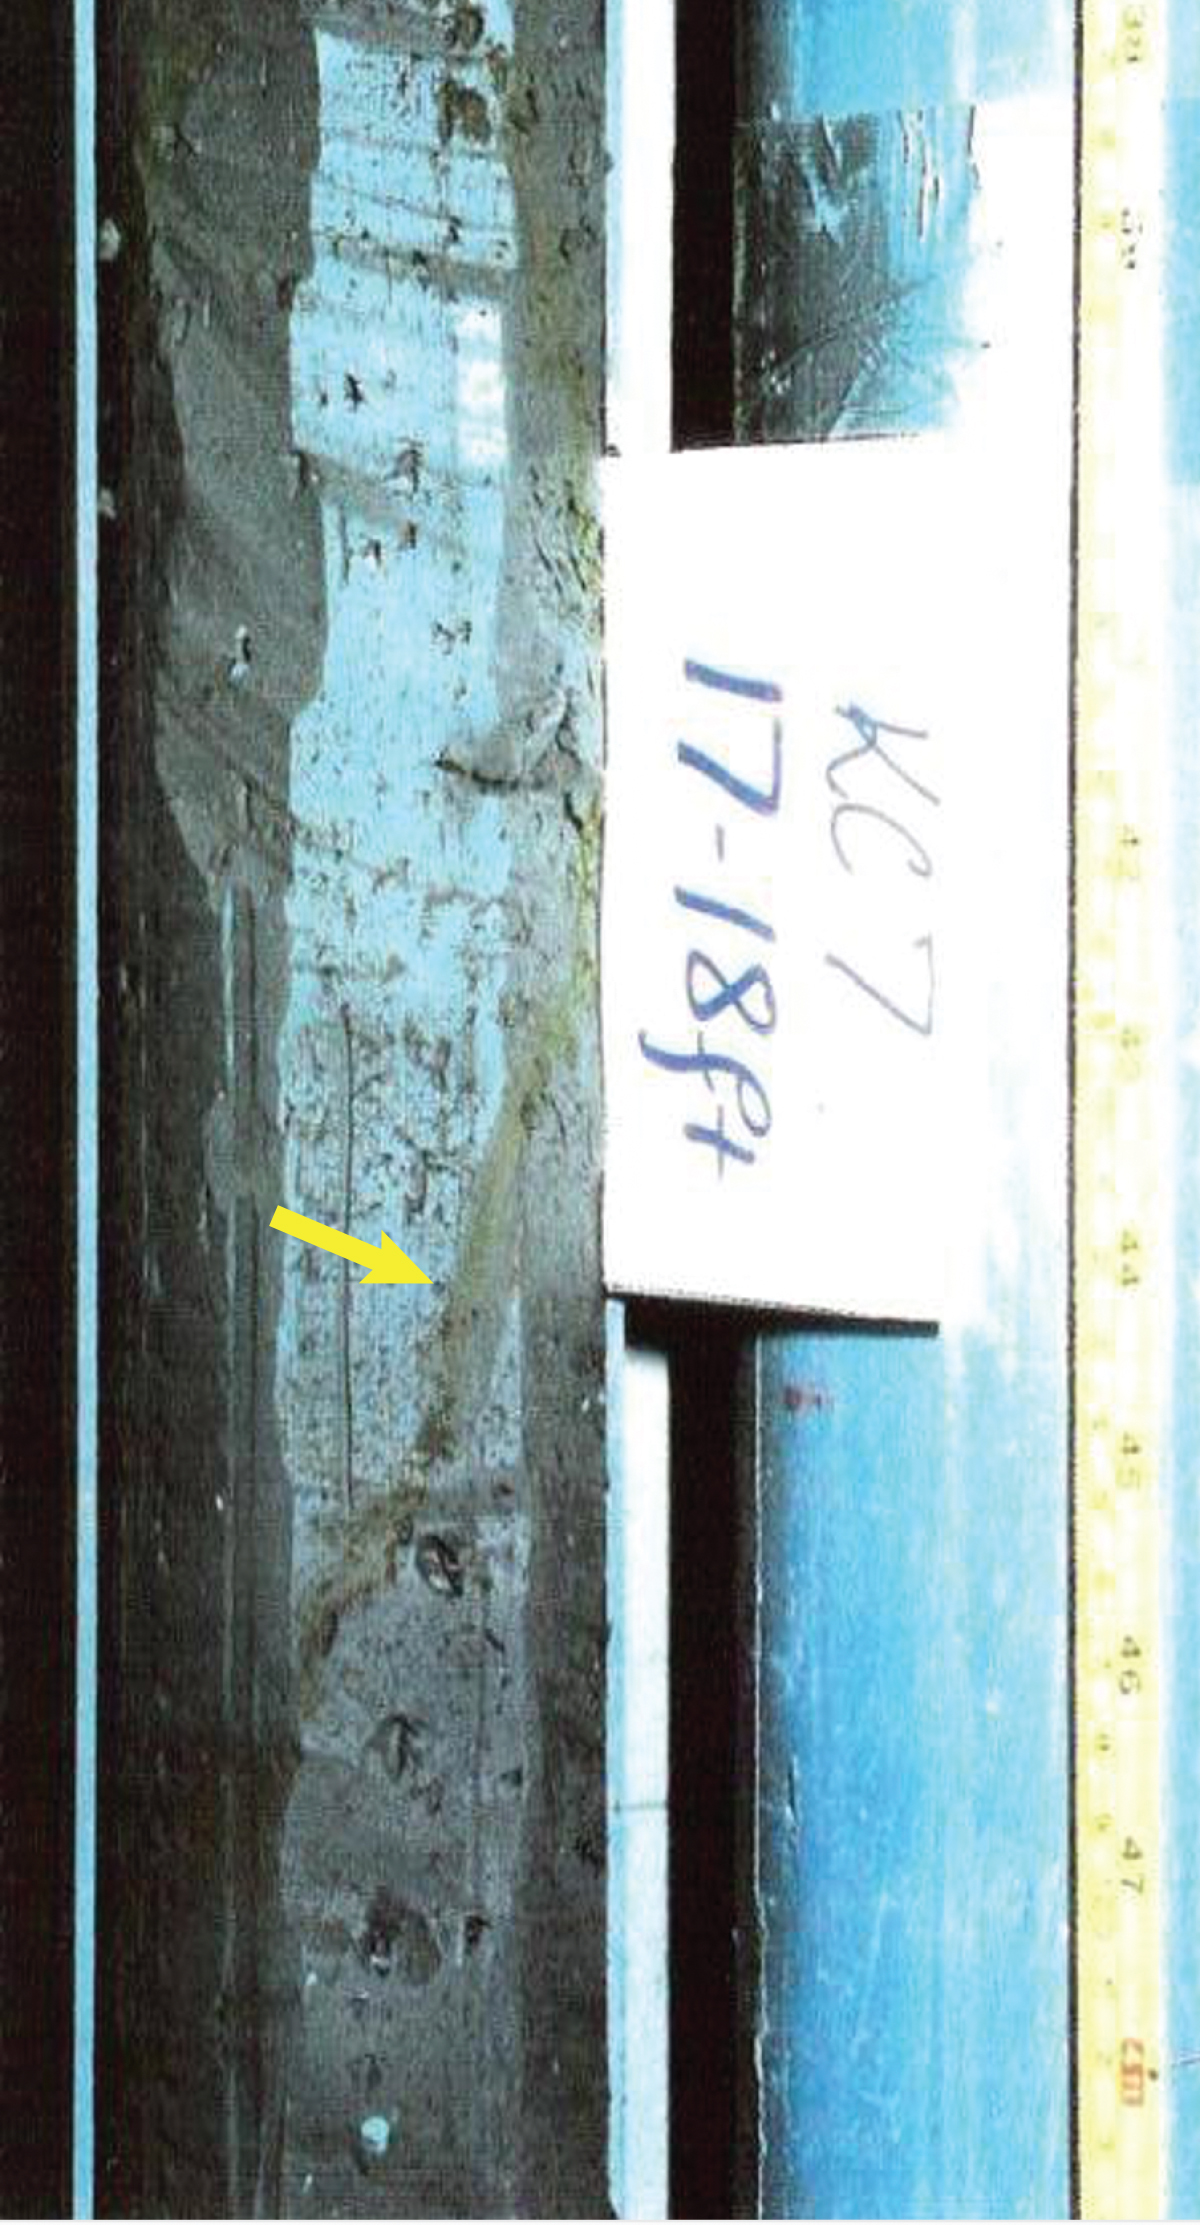
▲Figure 5. This photograph shows a fractured clay core from Essex County, Ontario. The fracture is the reddish slash (at the tip of the yellow arrow) between 17 ft and 18 ft (5.2 m and 5.5 m) below ground level. This core was part of an isotopic investigation of the age distribution of the groundwater in a thick clayey aquitard.
Second, field tests of hydraulic conductivity, which are conducted in vertical monitoring wells, may also miss fractures. Because many soil borings are advanced with a spinning drill bit or auger, the drilling process may seal the fractures. Both laboratory and field tests of hydraulic conductivities can produce lower hydraulic conductivity values than the actual field conditions if fractures are missed or sealed. This results in lower calculated groundwater velocities, slower calculated chemical transport rates than would occur in the field, and a false sense of security with respect to the integrity of the clay as a barrier to groundwater movement.
Third, finding gaps in, or at the edges of, clayey soil aquitards by conventional drilling can be an expensive trial-and-error process. Many years ago, our firm characterized a 1960s-era landfill used by a group of municipalities that was being sued by the State and private parties for contaminating the groundwater. The landfill was developed in an old sand pit without an artificial liner, as many were at that time, but was underlain by a clayey soil aquitard. We had conducted an intensive investigation of the site conditions and collected additional data on the underlying aquitard (e.g., groundwater-level data) that indicated a continuous aquitard. Nevertheless, the State challenged the continuity and extent of the clayey soil aquitard in the area immediately north of the landfill. We suggested advancing six shallow soil borings immediately north of the landfill, with both parties observing the drilling, to evaluate the continuity of the clayey soil aquitard. All six borings indicated the clayey soil indeed extended north of the landfill. In this case, because the site was so intensively investigated, we were confident of the continuity of the aquitard even before the additional borings. However, other less intensively characterized sites might require significantly more investigation and investment to convince regulators of the continuity of clayey soil aquitards beneath waste disposal sites.
Using isotopes in water molecules to evaluate containment potential by a clayey aquitard
Although the general chemical formula of water is H2O, both hydrogen (H) and oxygen (O) have several isotopes. Isotopes are versions of an element that contain different numbers of neutrons in their nuclei. The most common isotopic form of oxygen in water is oxygen-16 (H216O), but water can also contain some molecules with oxygen-18 (H218O). Similarly, the most common form of hydrogen in water is protium (1H2O), but water also contains some molecules with deuterium (2H1HO) and tritium (3H1HO).
The distribution of concentrations of 18O, 2H, and 3H in groundwater can be used to determine when precipitation first entered the groundwater system (7). There are four factors to consider when using 18O, 2H, and 3H for such an evaluation:
- The concentrations of these isotopes in precipitation have changed significantly over time (over thousands of years for 18O and 2H and decades for 3H). These changes are well-documented in the literature and are discussed later in this article.
- Since most groundwater originates as precipitation that directly infiltrates into the ground (as opposed to infiltrating through a lake bottom, for example), the water molecules in the precipitation and hence in the groundwater containing these isotopes indicates the time period of the precipitation (i.e., a time imprint).
- At the low temperatures associated with most shallow groundwater flow systems, the time imprint is preserved unless groundwater from two distinct groundwater masses mix.
- Water molecules containing these isotopes travel at the same rate and follow the same flow paths as “average” water (1H216O).
Considering all of these factors, the distribution of 18O, 2H, and 3H in groundwater indicates when the groundwater recharged from precipitation.
Using 18O and 2H to estimate groundwater age
18O and 2H concentrations in water are expressed in standard delta (δ) notation in parts per thousand (‰) differences relative to the Standard Mean Ocean Water (SMOW) (8). A good linear relationship, called the Global Meteoric Water Line (GMWL), exists between δ18O and δ2H values for worldwide precipitation and groundwater (8). Dansgaard (9) observed that δ18O and δ2H values for current precipitation at a given location depend on the mean annual air temperature and the location on the continent. Although the δ18O and δ2H values of very shallow groundwater might reflect seasonal variability in precipitation δ18O and δ2H values, deeper groundwater acquires the long-term average δ18O and δ2H values of the mean annual precipitation.
Edwards and Fritz (10) and others have demonstrated that the δ18O and δ2H values of precipitation during the glacial periods in North America were similar to current values in polar regions but much different from precipitation in many non-polar regions today (Figure 6). Vertical profiles of δ18O and δ2H values in groundwater in massive clayey aquitards (without fractures) reflect climatic change over time — from glacial (cooler) periods thousands of years ago at depth to warmer temperatures like current ones near the ground surface (3).
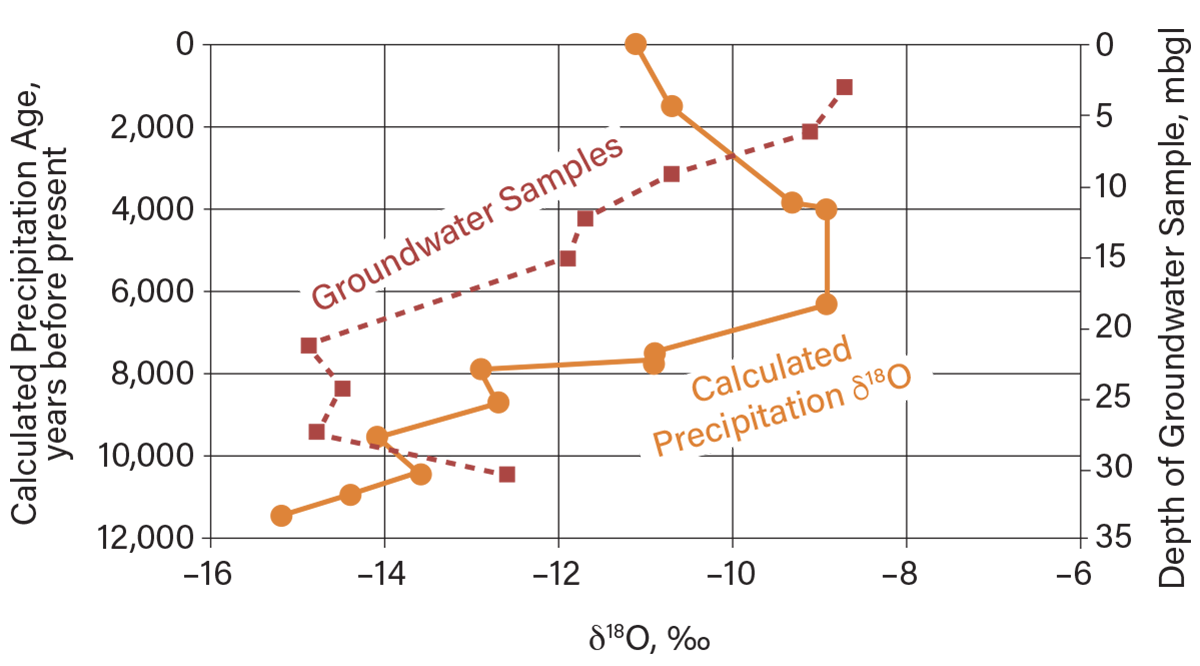
▲Figure 6. Distribution of δ18O with depth in a thick clayey soil aquitard in Essex County, Ontario (11). As indicated by the red dashed line, the near-surface groundwater has δ18O values similar to current precipitation, while the deep groundwater (~20 m below ground level) has δ18O values similar to precipitation during glacial times, on the order of 10,000 years ago (10).
Figure 6 shows the vertical distribution in δ18O values in groundwater with depth at a clayey aquitard site in Essex County, Ontario (11). The data indicate a mix of δ18O values in groundwater with depth that reflects recent precipitation (about –8 ‰ to –10 ‰) near the ground surface, while values at depth (about –14 ‰ to –16 ‰) indicate mixing with groundwater originating from precipitation in a cold glacial climate that predominated thousands of years ago. In other words, the near-surface δ18O values in groundwater indicate movement of groundwater that may be very recent, whereas the deep groundwater is thousands of years old. Therefore, chemicals released from a waste disposal site could move readily in the near surface, but not into deeper zones.
Using 3H to estimate groundwater age
3H is a radiogenic isotope with a half-life of about 12.3 years (1). 3H analyses are expressed in tritium units (TU), where 1 TU is equal to one atom of 3H per 1018 1H atoms. Figure 7 shows the tritium distribution in precipitation in Ottawa, Ontario, which can be used as a time imprint (tritium records are available for many locations in North America, but Ottawa has the longest record) (12). Prior to the beginning of large-scale atmospheric testing of thermonuclear devices in 1952, natural 3H concentrations in precipitation ranged from 5 TU to 20 TU (13). Beginning in 1952, atmospheric tests of thermonuclear devices increased the concentration of 3H in precipitation by up to three orders of magnitude higher than natural levels. 3H concentrations in precipitation reached a peak of several thousand TUs in 1963. The atmospheric nuclear test ban treaty of 1963 greatly reduced the input of anthropogenic 3H, and concentrations of 3H in precipitation gradually diminished. During the past two decades, 3H concentrations in precipitation have returned to natural levels.
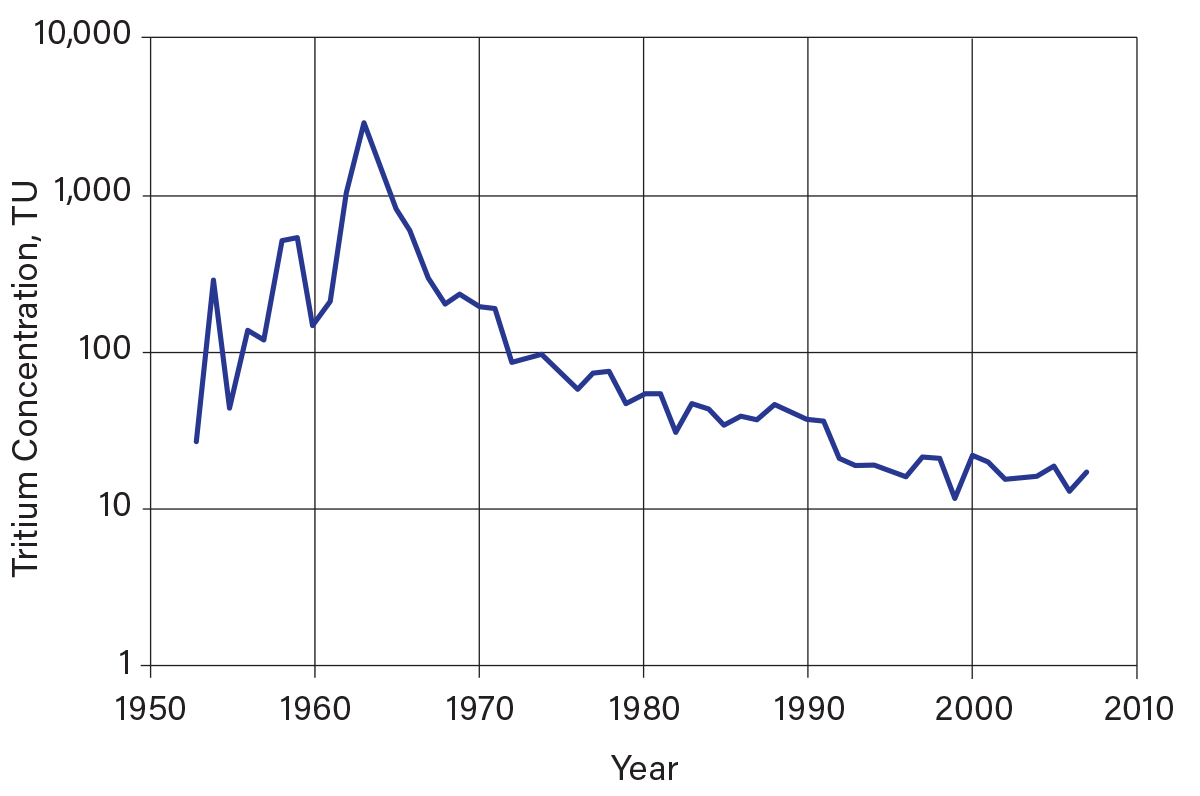
▲Figure 7. Average annual tritium concentration in precipitation in Ottawa, Ontario (12). Tritium concentrations in precipitation began to increase during the 1950s due to the advent of atmospheric testing of thermonuclear devices, until they peaked in 1963 in the northern hemisphere following the atmospheric nuclear test ban treaty. The gradual decline of tritium in precipitation from 1963 onward is the result of mixing in the upper atmosphere and the decay of tritium.
The 3H signatures of shallow and deep groundwater may be different due to timing and location of recharge by precipitation. In humid areas, about one-third of precipitation eventually recharges (becomes) groundwater; the remainder of the precipitation does not become groundwater as it runs off to streams and lakes, is used by plants, or evaporates. Most shallow groundwater is recharged directly from precipitation that infiltrates the ground, and as such, most shallow groundwater assumes the most recent precipitation 3H signature. Deeper groundwater may be separated from shallow groundwater by an aquitard or by groundwater flow conditions that inhibit mixing of the shallow and deep groundwater. In addition, deeper groundwater may only get recharged in limited areas. As such, deeper groundwater may be isolated from recent precipitation recharge and carries the 3H signature of the precipitation recharge from an earlier time and a distant location.
Once the recharge becomes groundwater, the 3H concentration in groundwater progressively diminishes due to radioactive decay. We can use the observed 3H concentrations in groundwater and the decay rate of 3H to estimate groundwater age (when the precipitation recharged the groundwater). In general, groundwater recharged within the past 60 years will have measurable 3H (from nuclear bomb tritium and more recently, natural tritium production); groundwater recharged more than 60 years ago and isolated from more recent recharge, however, will now contain virtually no measurable 3H.
Case studies involving isotopes to evaluate containment potential
In the first case study, Chekiri (14) used 18O and 3H to evaluate the containment potential of thick clayey soils in Essex County, Ontario. This area had been mentioned as a potential site for hazardous waste landfilling; however, a regional investigation of the 18O concentrations in the groundwater underlying the clayey aquitard indicated there was recent (not glacial age) groundwater in parts of the county. In addition, Chekiri investigated the nature and vertical extent of fractures in the clayey soil aquitard that would need to be considered with respect to shallow groundwater flow (e.g.,Figure 4).
Chekiri collected groundwater samples with depth and tested them for 18O and 3H concentrations to determine the depth of active groundwater movement (the fractured clay zone). He obtained most of his groundwater samples from soil cores that he squeezed with a hydraulic press; some samples came from conventional monitoring wells. Figure 8 indicates that active groundwater movement (3H > 10 TU, at the time) occurs in the uppermost 5 m. Below this point, there is minimal active groundwater flow. If this had been a candidate site for a hazardous waste landfill, lagoon, or sanitary landfill, measures would need to be taken to control groundwater movement in the uppermost 5 m of the soil.
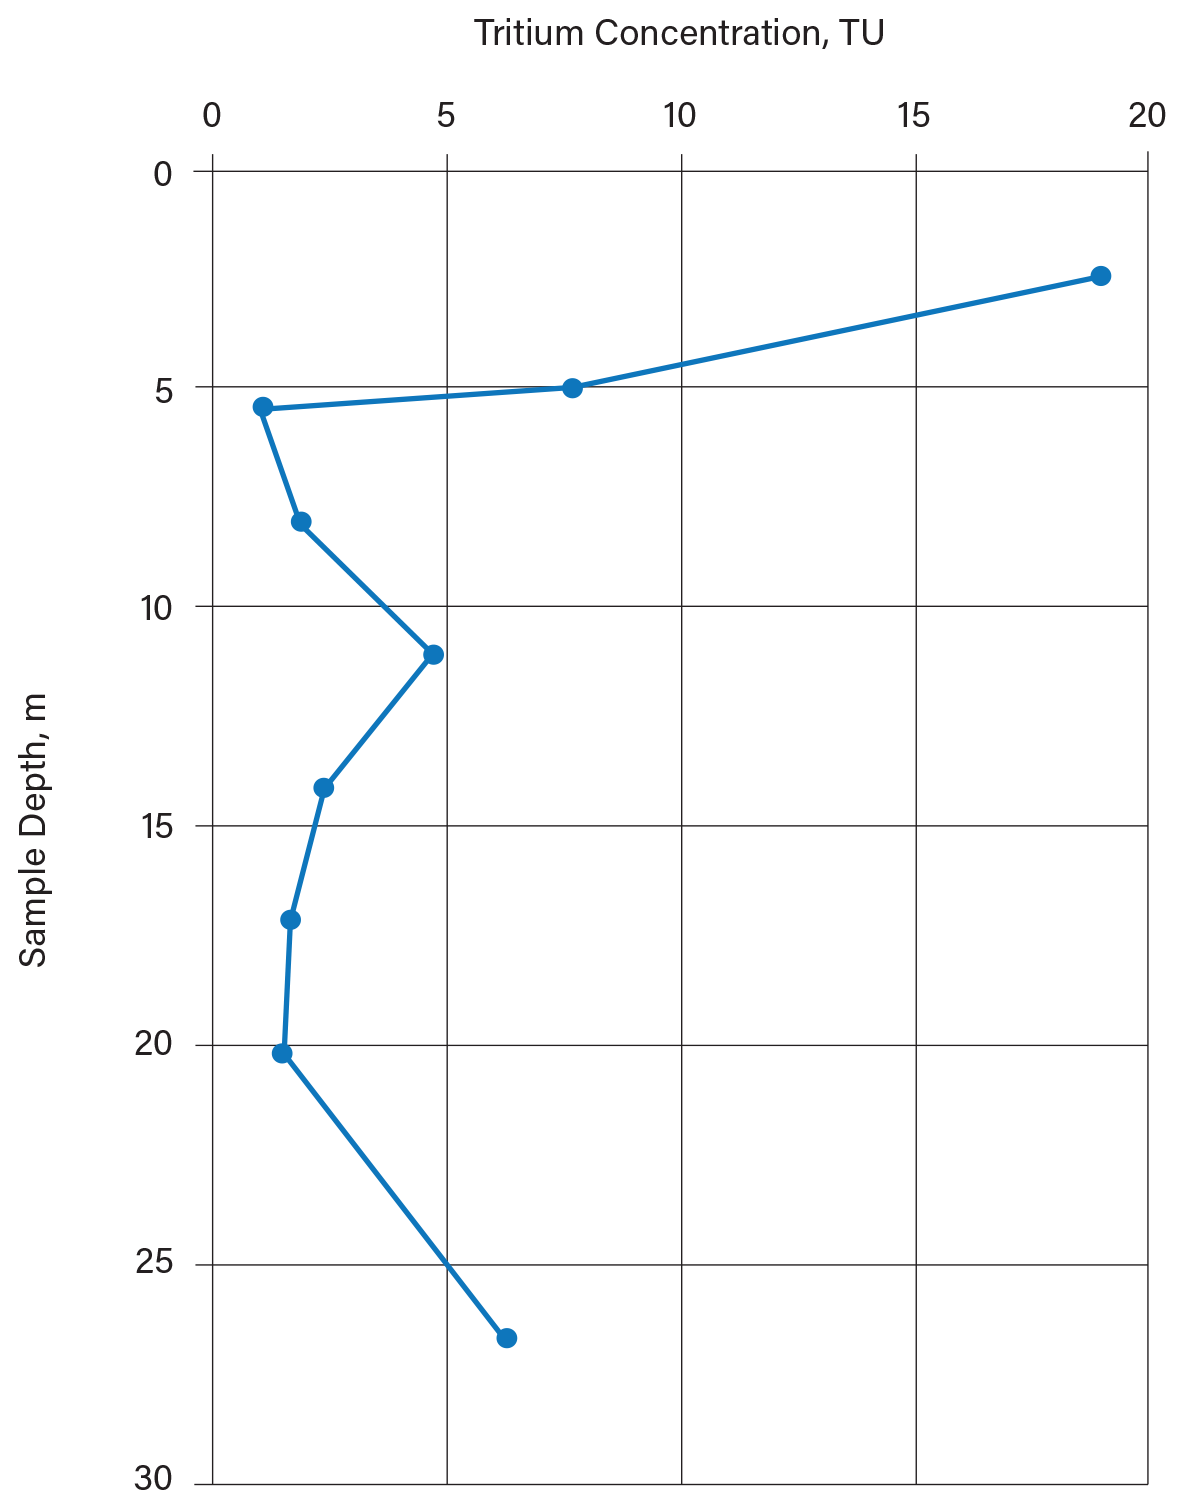
▲Figure 8. Distribution of tritium in groundwater with depth in clayey soil was investigated in Essex County, Ontario (14). The shallow (uppermost 5 m) groundwater was recharged after 1952, while the deep groundwater was recharged before 1952. Lagoon or landfill planning would need to account for active groundwater movement in the uppermost 5 m of the aquitard. The elevated tritium at depth is apparently from younger groundwater that has migrated laterally beneath the aquitard from a recharge area south of the site.
In the second case study, Sklash and Gorman (15) used 18O and 3H to evaluate the containment performance of thick clayey soils at a hazardous waste landfill in Wayne County, MI. Landfill owners and operators must demonstrate that the clayey aquitard beneath the landfill is continuous and effective below the landfill. This can be accomplished by drilling numerous soil borings to demonstrate the continuity and areal extent of the clay till aquitard. Alternatively, the distribution of 3H and 18O (or 2H) in groundwater from existing monitoring wells open below the aquitard can be used.
Sklash and Gorman (15) collected groundwater samples from nine perimeter monitoring wells around a landfill cell and compared the isotopic concentrations to those of the leachate sump and a drain adjacent to the landfill. The Wayne Disposal Inc. Site No. 2 landfill is located 32 km west of Detroit, MI. The geology beneath the site consists of a thick clay till aquitard (11–18 mbgl) overlain by a thin alluvial sand unit (2.3–7.0 mbgl). A sand and gravel deposit between the clay till and the bedrock is a local water supply aquifer. Laboratory and field tests indicate the clayey till aquitard has a hydraulic conductivity on the order of 1×10⁻⁸ cm/sec (which should provide containment as long as the aquitard is continuous beyond the boundaries of the landfill and there are no fractures in the aquitard).
Figure 9 is a graph comparing the upgradient and downgradient isotopic (18O and 3H) concentrations in groundwater beneath the clayey aquitard and some shallow groundwater samples. The monitoring well locations with respect to the groundwater flow direction are indicated by the data marker shapes (upgradient or downgradient of the landfill). The vertical line on Figure 9 delineates the 3H concentrations (at the time of the investigation) in groundwater representative of pre- and post-1952 recharge. The most important observation in terms of 3H is that the groundwater from all monitoring wells contain 3H concentrations of less than 10 TU, and the landfill leachate (sump) and the East Edge Drain have 3H concentrations of more than 10 TU.
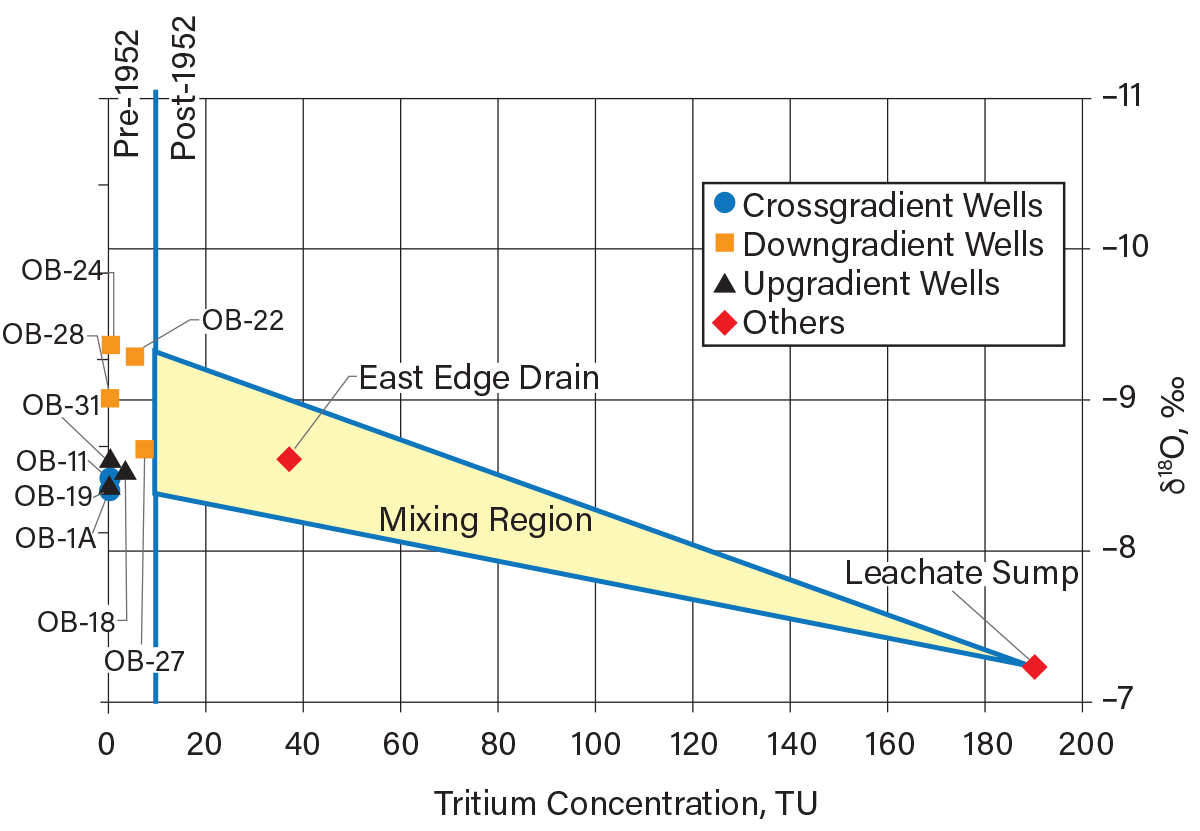
▲Figure 9. Tritium and oxygen-18 concentrations are shown here in groundwater, leachate, and surface drainage at a hazardous waste landfill in southeastern Michigan (15). None of the groundwater samples are impacted by the post-1952 recharge, meaning the aquitard provides good containment.
The groundwater 3H data indicate the groundwater beneath the clay aquitard recharged prior to 1952. This indicates that there was no movement of post-1952 water through the clay till aquitard into the aquifer and the aquitard is continuous beneath the landfill. The mean δ18O values of the nine groundwater samples is –8.8 ‰, which is consistent with δ18O values observed in shallow groundwater in the lower Great Lakes area. The leachate sump sample has a δ18O value of –7.2 ‰, which may be indicative of processes within the landfill (16).
Final thoughts
It is good practice to develop lagoons or landfills in places that have clayey soil aquitards. Establishing the presence of clayey soil, however, is only part of the equation.
Understanding how a clayey soil aquitard formed and/or changed during its geologic past may indicate how effective the aquitard will be in preventing contamination of groundwater by releases from lagoons and landfills. Regional geologic reports provide some insight into potential issues such as: the areal and vertical extents of the aquitard, whether to expect fractures or varves, or the likelihood of aquitard pinch outs.
Field and laboratory testing are needed to confirm the site-specific characteristics of the clayey soil, but testing can be problematic. Conventional vertical drilling can be misleading with respect to the presence, frequency, and depth of fractures. Conventional vertical monitoring wells may be misleading when evaluating the hydraulic conductivity of the upper part of the clayey soil formation.
A few strategies can help confirm waste disposal security in clayey soil formations. For example, angled boreholes are better than vertical boreholes for determining whether fractures in clay are present. Test pits are useful for determining whether fractures allow groundwater to flow around clay blocks. Finally, the vertical distribution of water isotopes (18O, 2H, and 3H) in groundwater within aquitards and the areal distribution of the water isotopes in the aquifer below an aquitard provide good indications of the containment potential offered by an aquitard.
Literature Cited
- Freeze, R. A., and J. A. Cherry, “Groundwater,” Prentice-Hall, Englewood Cliffs, NJ (1979).
- Fetter, C.W., “Applied Hydrogeology,” 4th Ed., Prentice-Hall, Upper Saddle River, NJ (2001).
- Desaulniers, D. E., et al., “Origin, Age and Movement of Porewater in Argillaceous Quaternary Deposits at Four Sites in Southwestern Ontario,” Journal of Hydrology, 50, pp. 231–257 (1981).
- Latta, B., “Ground-Water Conditions in the Smoky Hill Valley in Saline, Dickinson, and Geary Counties, Kansas,” Bulletin 84, State Geological Survey of Kansas, Division of Ground Water (1949).
- Cherry, J. A., et al., “Role of Aquitards in the Protection of Aquifers from Contamination: A ‘State of the Science’ Report,” AWWA Research Foundation, Denver, CO (2004).
- McKay, L., “Groundwater Flow and Contaminant Transport in Fractured Clay Till,” PhD Thesis, Univ. of Waterloo, Waterloo, ON (1991).
- Fritz, P., and J. C. Fontes, eds., “Handbook of Environmental Isotope Geochemistry, Vol. 1, The Terrestrial Environment,” Elsevier, Amsterdam, Netherlands (1980).
- Craig, H., “Standard for Reporting Concentrations of Deuterium and Oxygen-18 in Natural Waters,” Science, 133, pp. 1833–1834 (1961).
- Dansgaard, W., “Stable Isotopes in Precipitation,” Tellus, 16, pp. 436–438 (1964).
- Edwards, T. W. D., and P. Fritz, “Stable Isotope Paleoclimate Records for Southern Ontario, Canada: Comparison of Results from Marl and Wood,” Canadian Journal of Earth Sciences, 25, pp. 1397–1406 (1988).
- Ibrahim, O., “Groundwater Recharge Investigation of a Linear Morphological Feature East of Belle River, Ontario,” MSc Thesis, Univ. of Windsor, Windsor, ON (1992).
- International Atomic Energy Agency, “Water Isotope System for Data Analysis, Visualization, and Electronic Retrieval,” Water Resources Programme - Monitoring Programme Data, http://www-naweb.iaea.org/napc/ih/IHS_resources_isohis.html (accessed Dec. 1, 2021).
- Payne, B. R., “Isotope Hydrology,” Advances in Hydroscience, 8, pp. 95–138 (1972).
- Chekiri, K., “Groundwater Recharge Above a Buried Esker in Essex County, Ontario,” PhD Thesis, Univ. of Windsor, Windsor, ON (1996).
- Sklash, M. G., and R. F. Gorman, “Use of Natural Tritium and Oxygen-18 for the Verification of ‘Upgradient’ Monitoring Wells,” Proceedings of Waste Tech 1986, Chicago, IL (1986).
- Fritz, P., et al., “Deuterium and Oxygen-18 Indicators of Leachate Movement from a Sanitary Landfill,” Interpretation of Environmental Isotopes and Hydrochemical Data in Groundwater Hydrology, International Atomic Energy Agency, Vienna, Austria, pp. 131–142 (1976).

Copyright Permissions
Would you like to reuse content from CEP Magazine? It’s easy to request permission to reuse content. Simply click here to connect instantly to licensing services, where you can choose from a list of options regarding how you would like to reuse the desired content and complete the transaction.