
Process intensifications are a critical part of process development in the chemical process industries (CPI). In addition to traditional approaches, identifying and resolving contradictions can bring about new and valuable process improvements.
As engineers working in the chemical process industries (CPI), our mantra is to find ways of making things “faster, better, cheaper.” This expression is well-known and was used often by Daniel Goldin, administrator of the National Aeronautics and Space Administration (NASA) from 1992 to 2001. To clarify, faster means more output in a defined time period (or the same output in less time); better means improved safety, quality, and sustainability; and cheaper means at lower capital and operating cost.
These objectives align well with current thinking about process intensification (PI). In 2015, the U.S. Dept. of Energy (DOE) ran a two-day workshop on process intensification (1). The report from this workshop defines PI as breakthroughs that lead to significant improvements in performance. The report outlines areas of opportunity such as thermal intensification, mixing and mass transfer, chemical separation and crosscutting technologies, and other opportunities.
Process intensification via contradictions
One approach to process intensification is to look for contradictions within the chemical process (2). A contradiction occurs when one action produces a useful result but also a harmful effect. For example, a chemical reaction may proceed at a higher rate if the temperature is increased, but the higher temperature also produces more unwanted byproducts.
Genrich Altshuller, an engineer in the former Soviet Union, studied contradictions extensively during the 1940s. In his studies, Altshuller observed that processes of many kinds were fundamentally limited by contradictions. This is because a contradiction implies a compromise. In a chemical reaction, the incremental value of the additional product obtained as a result of a slight temperature increase could more than compensate for the lower yield caused by producing more unwanted byproducts. Further temperature increases would reach a point of diminishing returns, where the temperature increase diminishes value. In such cases, engineers use an approach like Six Sigma to find the optimum operating point, a compromise between the benefits and harm of increasing temperature. If the compromise is avoided (e.g., an increase in temperature would not detract from the yield), the contradiction is resolved.
Function modeling
Modern chemical plants, petrochemical plants, and refineries are typically large complex operations. The number of areas and unit operations for potential improvement can be overwhelming. Identifying process improvement opportunities requires a systematic approach to manage and prioritize areas that offer significant performance improvements.
During World War II, labor, materials, and component parts were scarce and delays in manufacturing were common. Lawrence Miles, Jerry Leftow, and Harry Erlicher, engineers at General Electric (GE), recognized that substitutes could be used as long as the substitute performed essentially the same function as the original. In other words, it is not important what something is but rather what it does. This became known as function analysis.
Charles Bytheway, another GE engineer, developed a graphical technique to map the functions in a system and show their relationships. Bytheway’s approach is called the function analysis system technique (FAST). FAST diagrams show how, why, and when processes occur in a system (3).
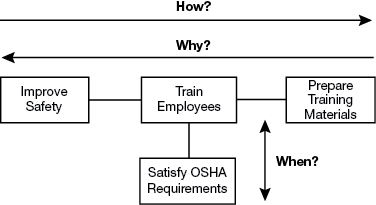
▲Figure 1. This sample FAST diagram describes the how, why, and when relationships associated with the primary function “improve safety.”
In a FAST diagram (Figure 1), the leftmost function is the primary function — it describes the desired action to be performed. Starting with the primary function, move to the right and ask: How is this function performed? Continue going from left to right asking “how?” The logic of the model is validated by moving from right to left and asking: Why is this function performed? Completing the how-why logic forms the primary logic path. Once the primary logic path is complete, examine each function and ask: When this function is performed, are there any consequential functions?
In the example in Figure 1, the primary function, improve safety, is on the left. Going from left to right, ask and answer a series of “how” questions: How do you improve safety? The answer is the connected function: train employees. How do you train employees? The connected function to the right explains: by preparing training materials.
The logic in the model can be validated by going from right to left and asking “why?” So, why do you prepare training materials? To train employees. And, why do you train employees? To improve safety.
Examine each function and ask: When this function is performed, are there any consequential functions? In this case, when you train employees, you satisfy U.S. Occupational Safety and Health Administration (OSHA) requirements.
FAST diagrams are limited in their ability to identify contradictions in chemical processes. First, the rigid structure can become overly complex when modeling large processes. To simplify the diagram, connect functions with arrows. When moving against the direction of the arrow, ask “how?” When moving in the direction of the arrow, ask “why?”
Second, FAST diagrams make no distinction between useful and harmful functions. Recall that a contradiction occurs when one action (useful function) produces a useful result (useful function) but also a harmful effect (harmful function). Therefore, it is helpful to make a visual distinction between useful and harmful functions in the function model. To do this, add a crosshatch to an arrow to indicate counteraction.
Figure 2 summarizes these modifications to the traditional FAST diagram. The useful Function A produces the useful Function B, as indicated by the connecting arrow. The same how-why logic is applied here. One function can counteract another. In this case, harmful Function C counteracts useful Function D, as indicated by the crosshatched arrow. A contradiction occurs when a useful function produces a useful result as well as a harmful effect. In this example, useful Function E produces useful Function F, but...
Would you like to access the complete CEP Article?
No problem. You just have to complete the following steps.
You have completed 0 of 2 steps.
-
Log in
You must be logged in to view this content. Log in now.
-
AIChE Membership
You must be an AIChE member to view this article. Join now.
Copyright Permissions
Would you like to reuse content from CEP Magazine? It’s easy to request permission to reuse content. Simply click here to connect instantly to licensing services, where you can choose from a list of options regarding how you would like to reuse the desired content and complete the transaction.