
Editor’s Note: A slightly different version of this article appears as the Perspective article in the May 2016 AIChE Journal (pp. 1402–1416).
Chemical engineers need data science tools to take advantage of the increasing amount of data available to them. Data storage, analysis, and visualization will play more important roles in the discipline.
Chemical engineers are dealing with more, and more-complex, data than ever before (1). Because of the proliferation of inexpensive instrumentation and the nearly ubiquitous high-bandwidth and low-latency connectivity, an engineer working in a modern plant has access to a tremendous amount of data. In the area of research and discovery, a student or researcher conducting data-intensive experiments, such as high-resolution particle tracking, might generate more data in an afternoon than a student from a previous decade would have generated in the entire time spent earning their PhD. For those conducting mathematical modeling and computer simulations, advanced algorithms and hardware now give simulators unprecedented resolution at the cost of massive increases in the dataset.
Because chemical engineering education and training have not kept pace with this explosion of data, chemical engineers will likely approach data as they have in the past — manually searching for relationships in the data, creating classical plots to visualize monovariate and bivariate correlations, and applying hypothesis-driven approaches. These techniques stem from a data-poor era when the engineer could manipulate relevant data in their mind. Without knowledge and training on how to handle data skillfully, most of the information from plants and refineries, data-intensive experiments, and computer simulations is wasted because engineers and researchers don’t know how to extract knowledge from the data.
Fortunately, a potential solution is on the horizon. The nascent field of data science aims to provide engineers with a means to manage huge datasets consisting of ensembles of spatio-temporal data, sensibly read the data in a computationally scalable manner, and extract knowledge from this pile of information using robust techniques whose statistical reliability can be quantified.
This article provides an overview of the core areas of data science and highlights several application areas, including molecular science and engineering, synthetic biology, and energy systems and management. The article closes with thoughts on how data science principles can be included in the undergraduate and graduate curricula.
What is data science?
Data science is commonly divided into three categories:
- data management
- statistical and machine learning
- visualization.
Within each category are many methods and tools that can be used by chemical engineers to address data-related challenges.
Data management
Data management refers to tools and methods to organize, sort, and process large, complex, static datasets and to enable real-time processing of streams of data from sensors, instruments, and simulations. Data management forms the foundation of data science. The way data are organized, stored, and processed significantly impacts the performance of downstream analyses, ease of sharing, and visualization.
In synthetic biology, each field (e.g., transcriptomics, proteomics, and metabolomics) will generate a unique dataset. For molecular- and nano-scale phenomena, data commonly take the form of trajectories or large ensembles of information. These data could be generated with computer simulations or collected from data-intensive experiments, such as those from high-resolution/high-speed microscopy. At the process and systems level, data are often complex and involve time-series data from online sensors and diagnostic tools.
Since the early 1980s, spreadsheets have been an entry-level tool for handling two-dimensional (i.e., rows and columns) data. Their utility begins to break down, however, for large datasets (tens of thousands of rows), higher-dimensionality datasets, data that require complex transformations, or data that must be integrated across many datasets. Moreover, spreadsheets are not amenable to subsetting (i.e., extracting a subset of data from the larger set) or rapid programmatic access from external tools for machine learning or visualization.
Relational databases are the next step up from spreadsheets and are used to manage more-complex data with more-demanding analytical requirements (2). Relational database management systems (RDBMs) organize data into two-dimensional tables that are linked by an identifying descriptor and users can access and query these data using variations of structured query language (SQL). An engineer can make complex queries that involve relationships between the tables and data within the tables. For example, an engineer could find all of the molecules with a specific moiety or all of the molecules above a given molecular weight. Tables can be indexed for speed of access at the expense of the storage footprint. Free and open-source RDBMs include Postgress SQL and MySQL.
The steadily increasing sophistication of data storage has brought with it new challenges related to analytics. The power required to perform computations with such large and complex datasets is exceeding the capabilities of single desktop machines or single high-performance computers with tens of processor cores. Instead, new computing strategies that leverage tightly coupled computers — called nodes — which share high-bandwidth, low-latency networks and storage space, have been developed. Although such computer clusters have proven to be useful, particularly for tasks such as molecular simulation where clustered nodes frequently exchange large amounts of data, they remain quite expensive.
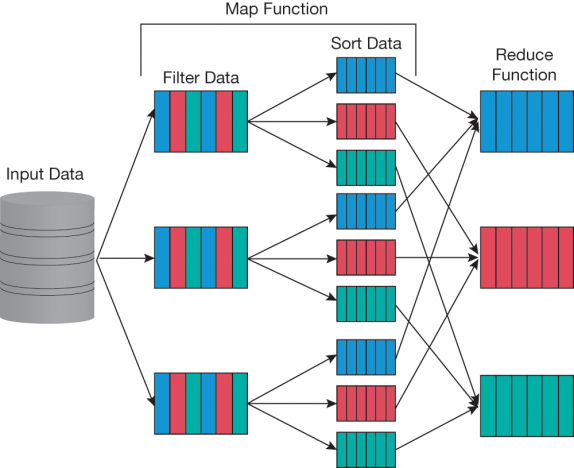
▲Figure 1. The MapReduce algorithm consists of two primary steps — map and reduce. In the map step, data are sorted and split between computing units. Subsequently, in the reduce step, some aggregation function (e.g., mean, maximum, sum) is applied to the mapped data. Hadoop is a framework for applying this paradigm in a distributed computational environment over multiple computing nodes where each node (three are shown here) takes some subset of the data during the map step.
A less expensive option — a collection of loosely coupled, relatively inexpensive computers with standard network connectivity working on the same problem — can be used for computational problems that do not require tight coupling between computers. One example is the MapReduce algorithm (3) developed by Google. A MapReduce program consists of a map procedure that filters and sorts the data and a reduce procedure that summarizes or aggregates data across multiple nodes (Figure 1). The most well-known, open-source implementation of MapReduce is Apache Hadoop (4), which has a rich software ecosystem to support it. The strengths of Hadoop lie in its ability to coordinate the execution, in a fault-tolerant manner, of many independent computers.
Environments...
Would you like to access the complete CEP Article?
No problem. You just have to complete the following steps.
You have completed 0 of 2 steps.
-
Log in
You must be logged in to view this content. Log in now.
-
AIChE Membership
You must be an AIChE member to view this article. Join now.
Copyright Permissions
Would you like to reuse content from CEP Magazine? It’s easy to request permission to reuse content. Simply click here to connect instantly to licensing services, where you can choose from a list of options regarding how you would like to reuse the desired content and complete the transaction.